Prerequisites
Summary
This tutorial will provide step-by-step instructions for the following:
- Setting up an Azure Time Series Insights environment
- Publishing live tag data and events to Time Series Insights via Azure IoT Hub
- Viewing the data that has been pushed to Time Series Insights
Upon completion of this tutorial you will have an Ignition Gateway with the Azure Injector module connected and publishing live tag data to an Azure IoT Hub which will be configured as a data source for Time Series Insights. Those messages will then be automatically stored in Time Series Insights.
Tutorial
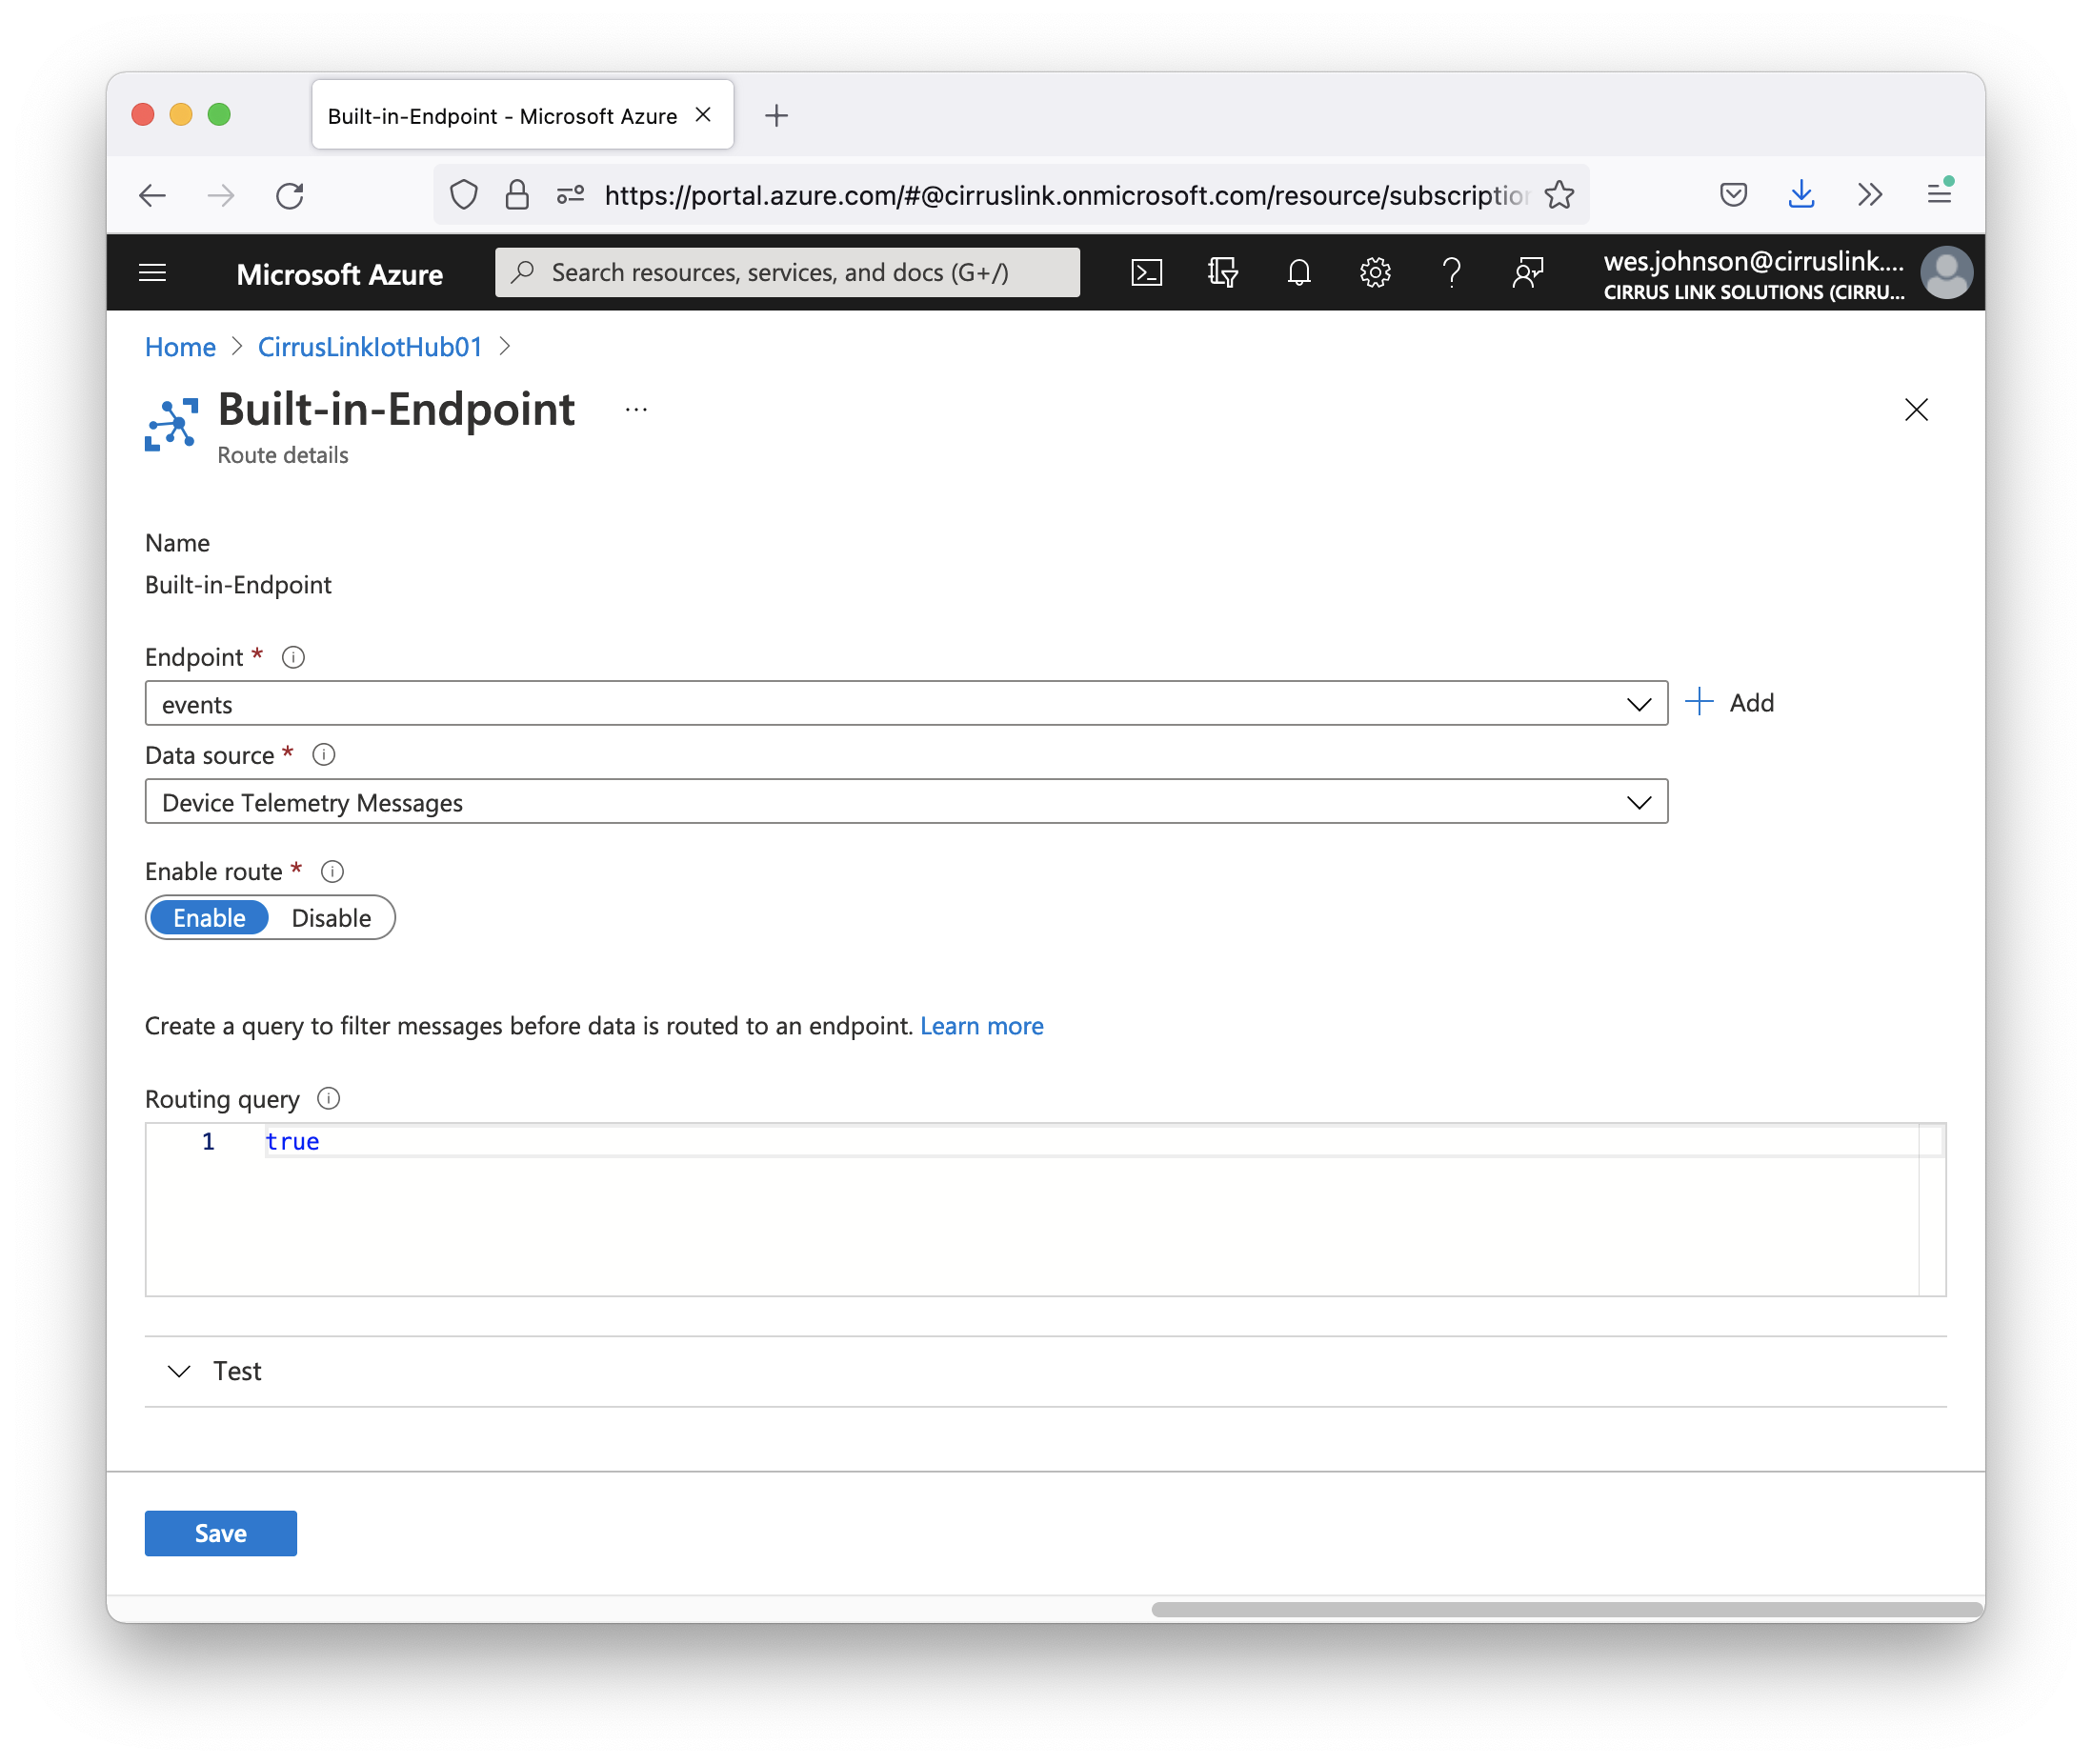
Parts of the environment created and configured in the Quick Start and Message Based Routing tutorial are used in this guide. So, make sure you have completed this before proceeding.
Step 2: Setting up the Time Series Insights environment
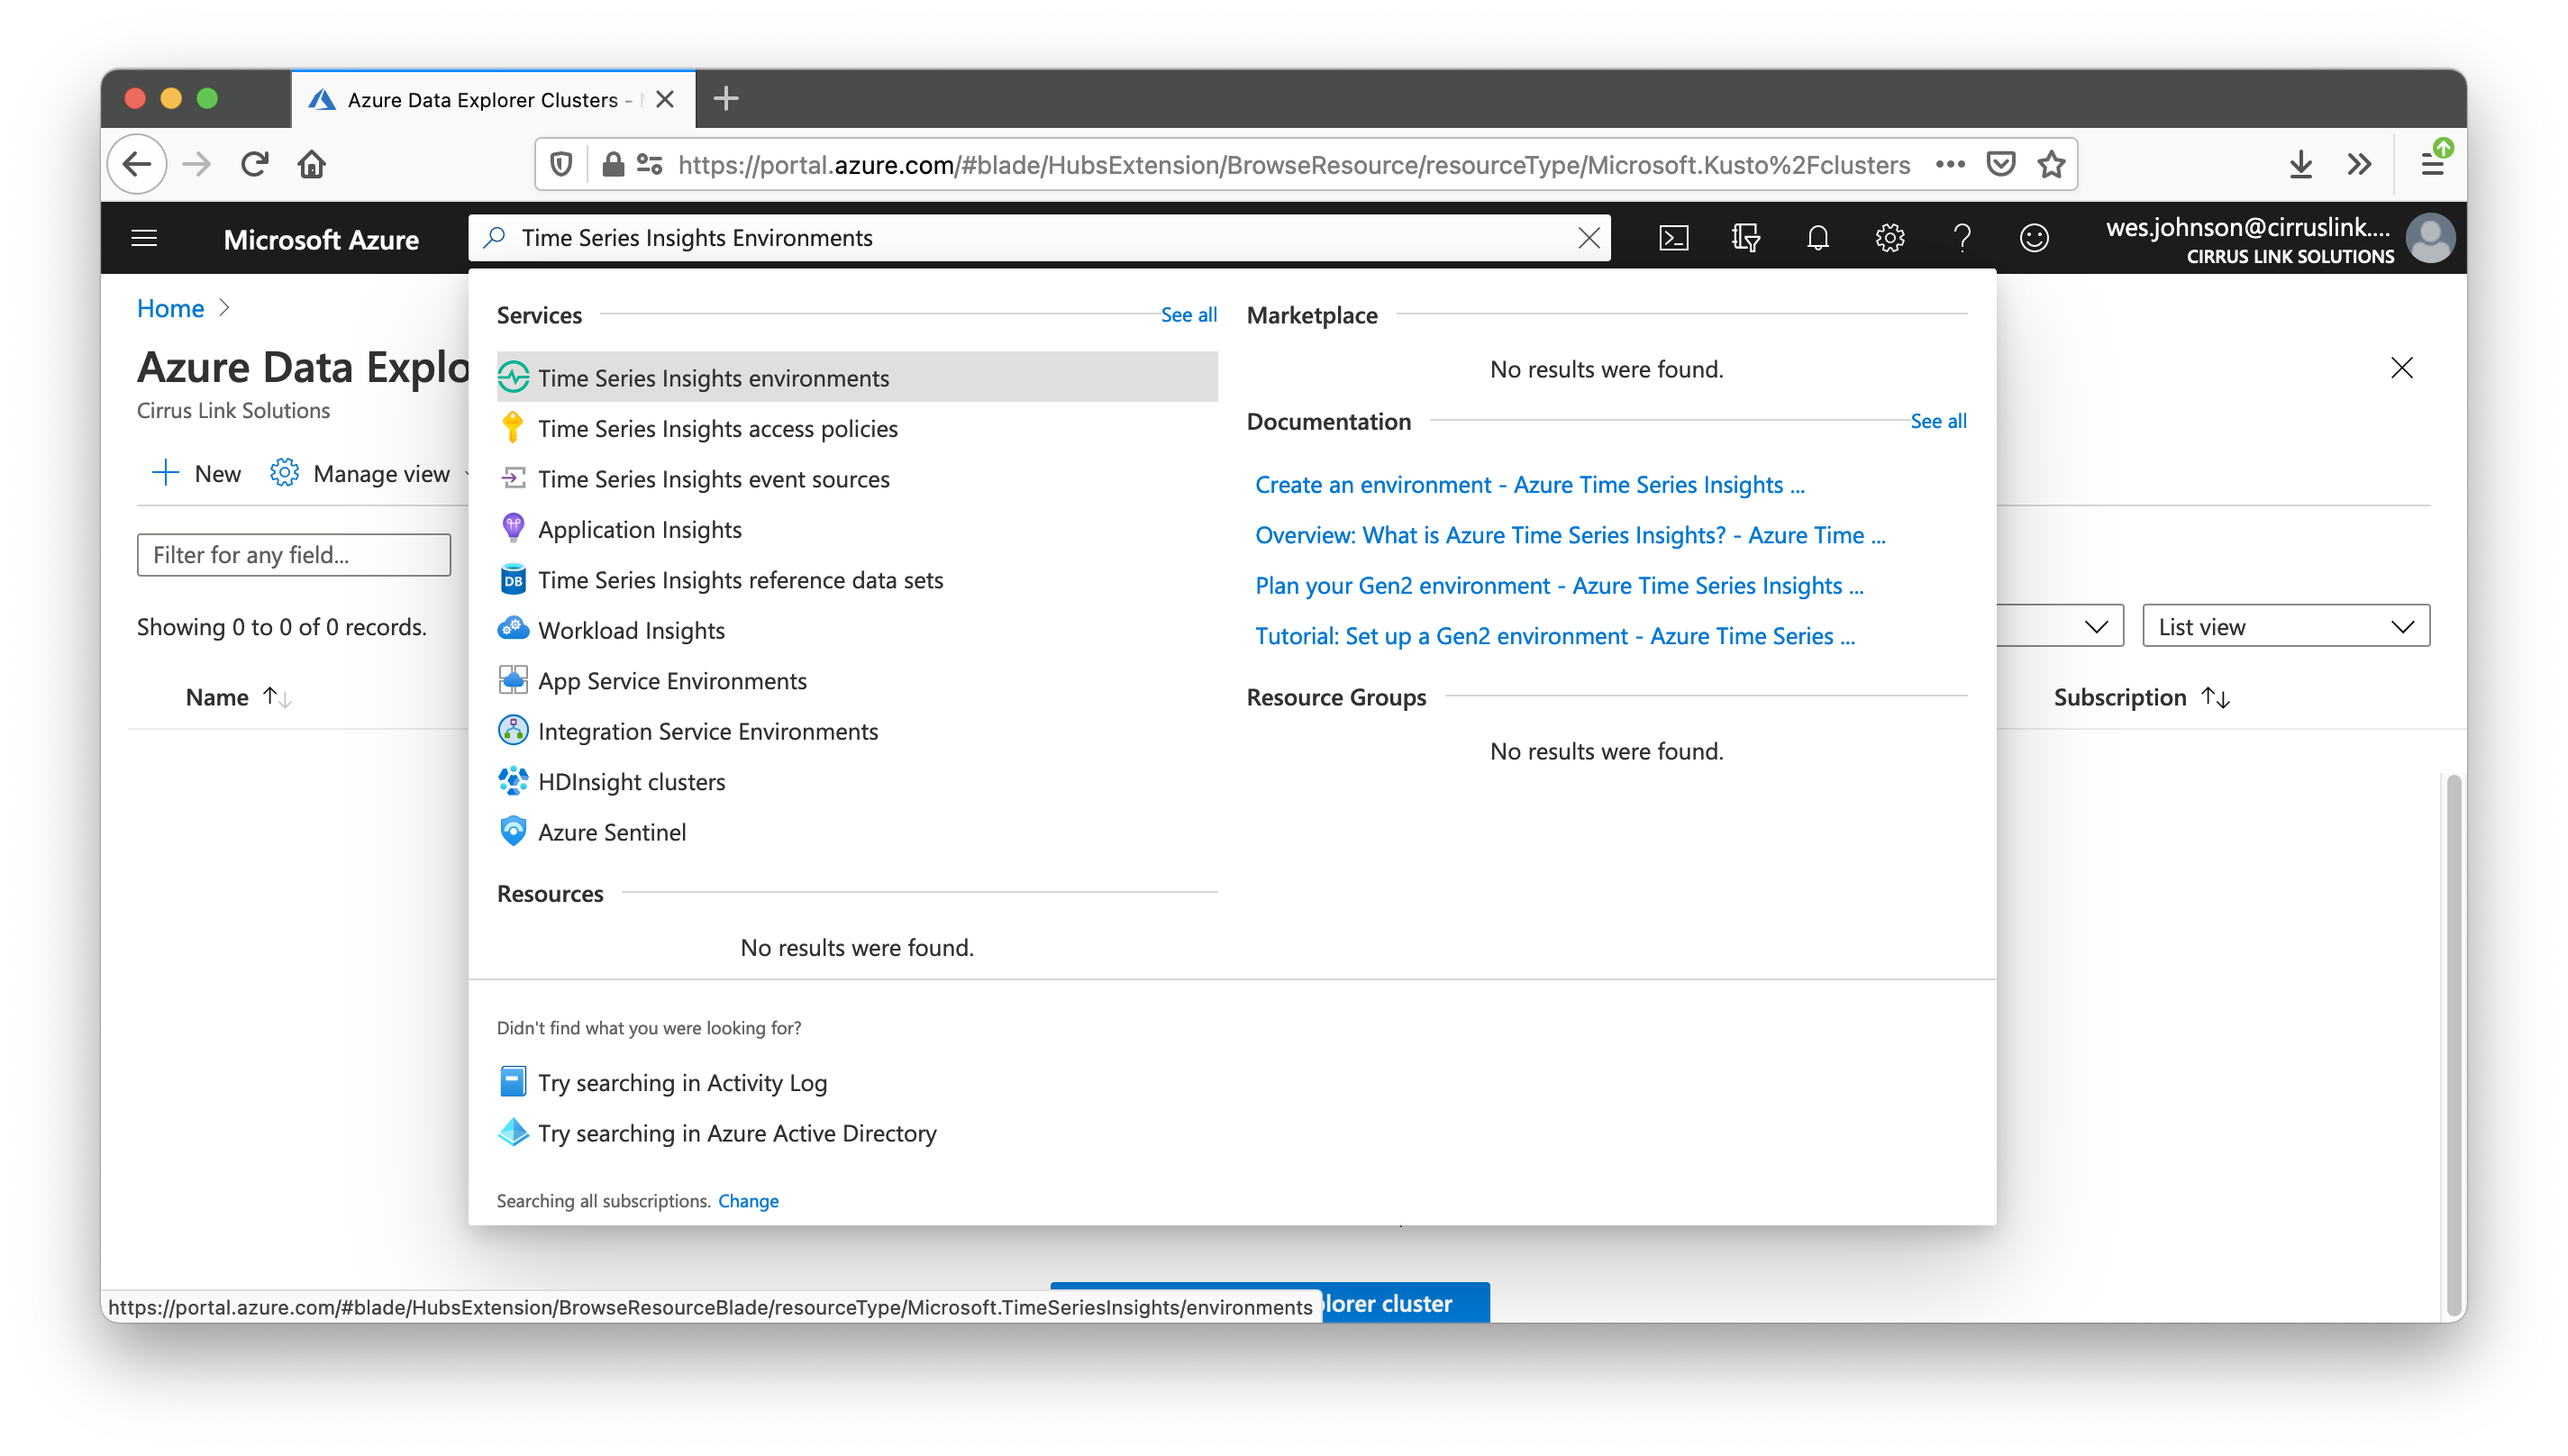
Log into to https://portal.azure.com and type 'Time Series Insights Environments' into the search bar at the top as shown below and select 'Time Series Insights Environments'.
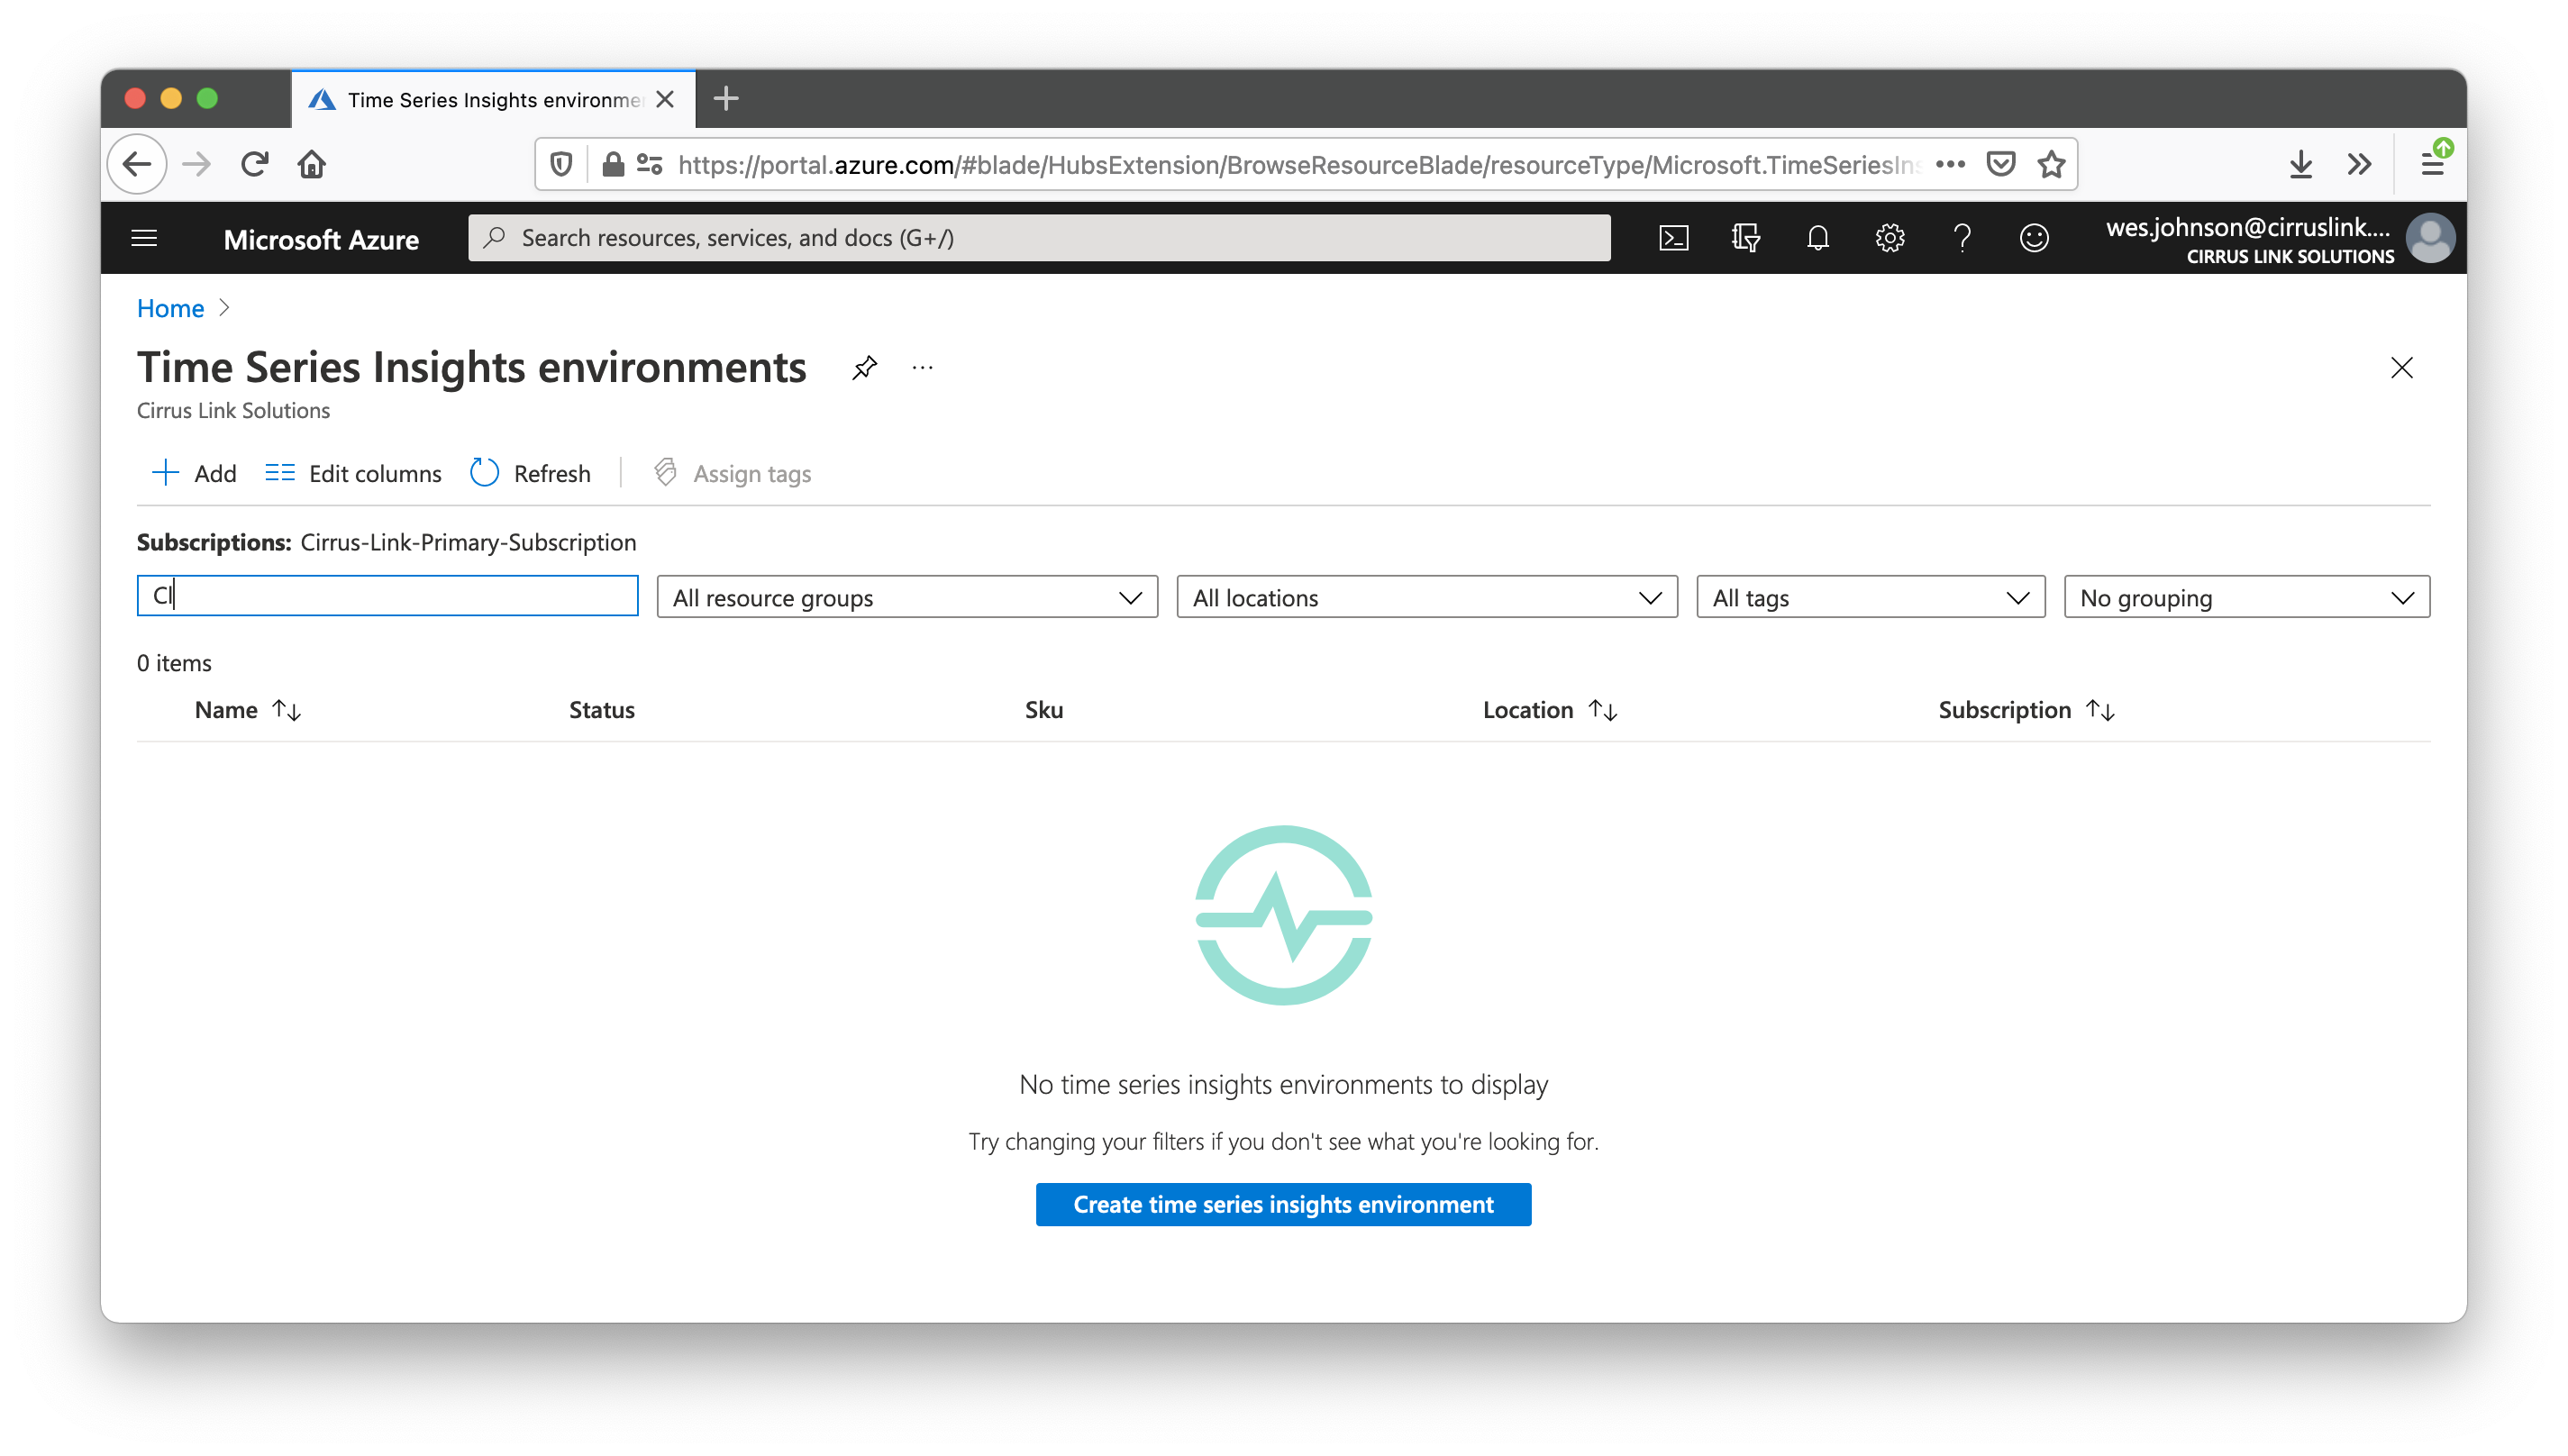
After doing so, you should see the following. Click the '+ Add' Button near the top left corner to create a new Time Series Insights Environment.
After clicking the 'Add' button, you will see the following.
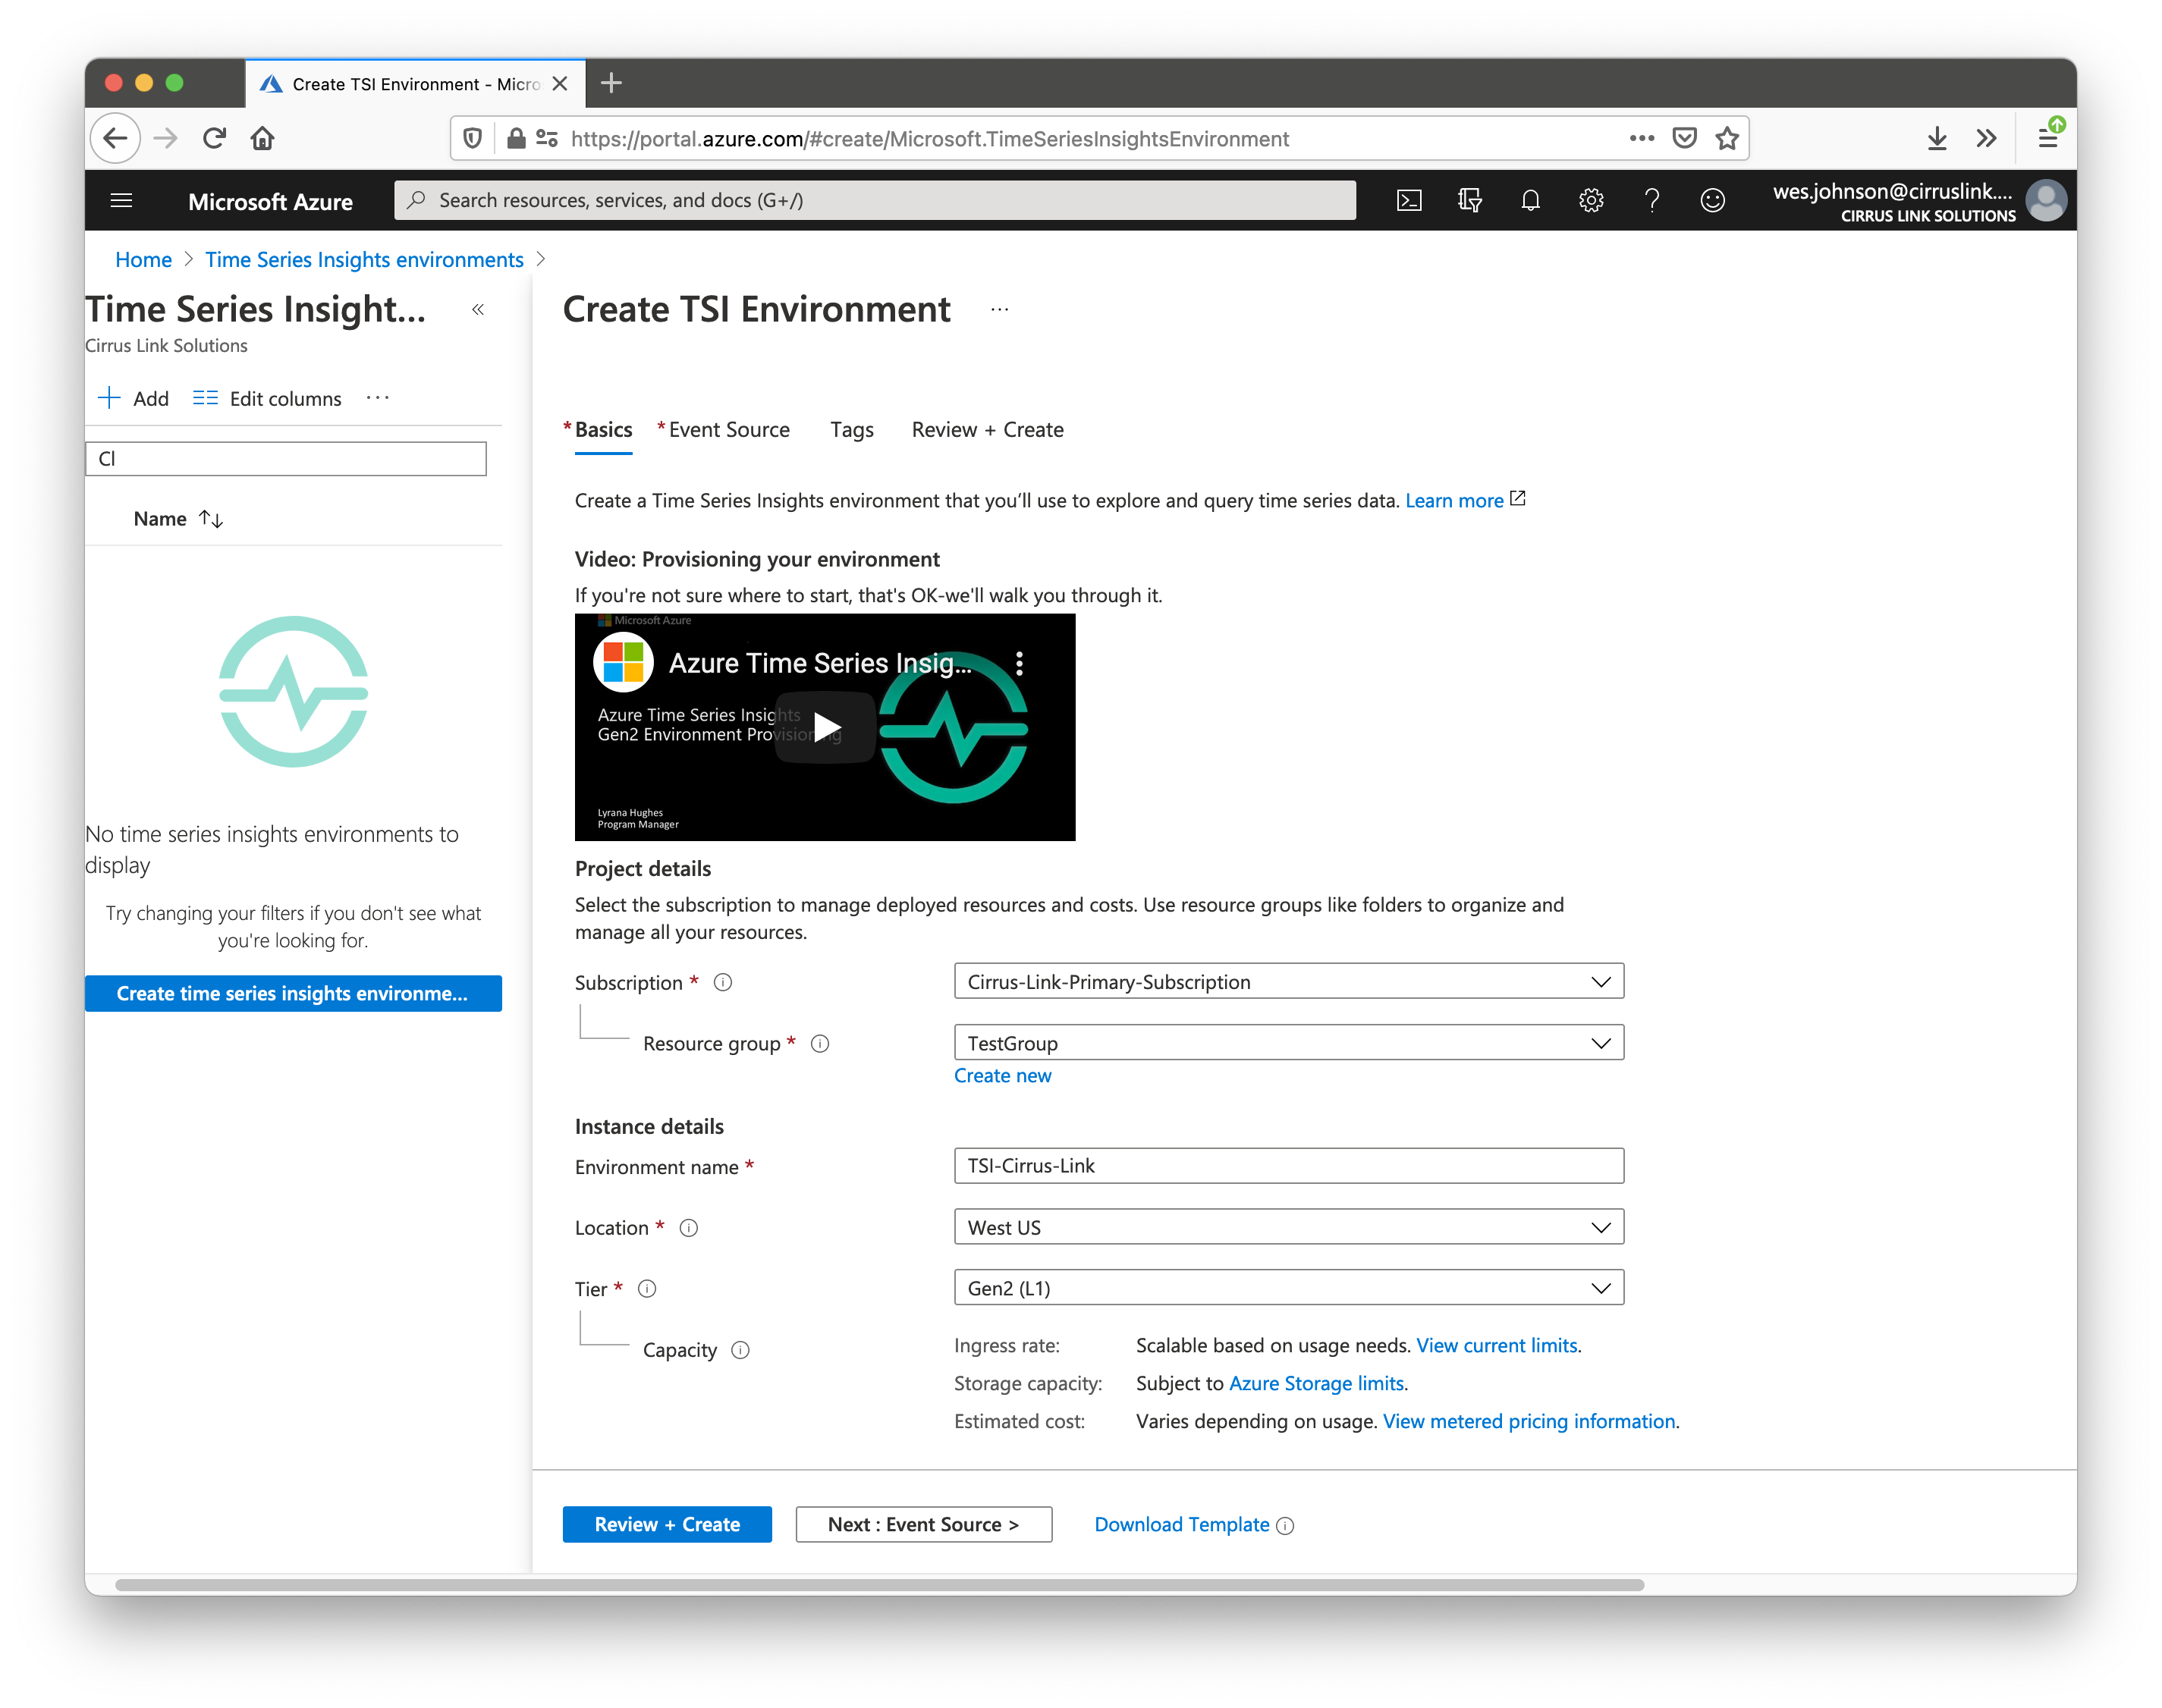
Set the Subscription, Resource Group, and environment name, and Location as shown above. Then scroll down. After doing so, you will see the following.
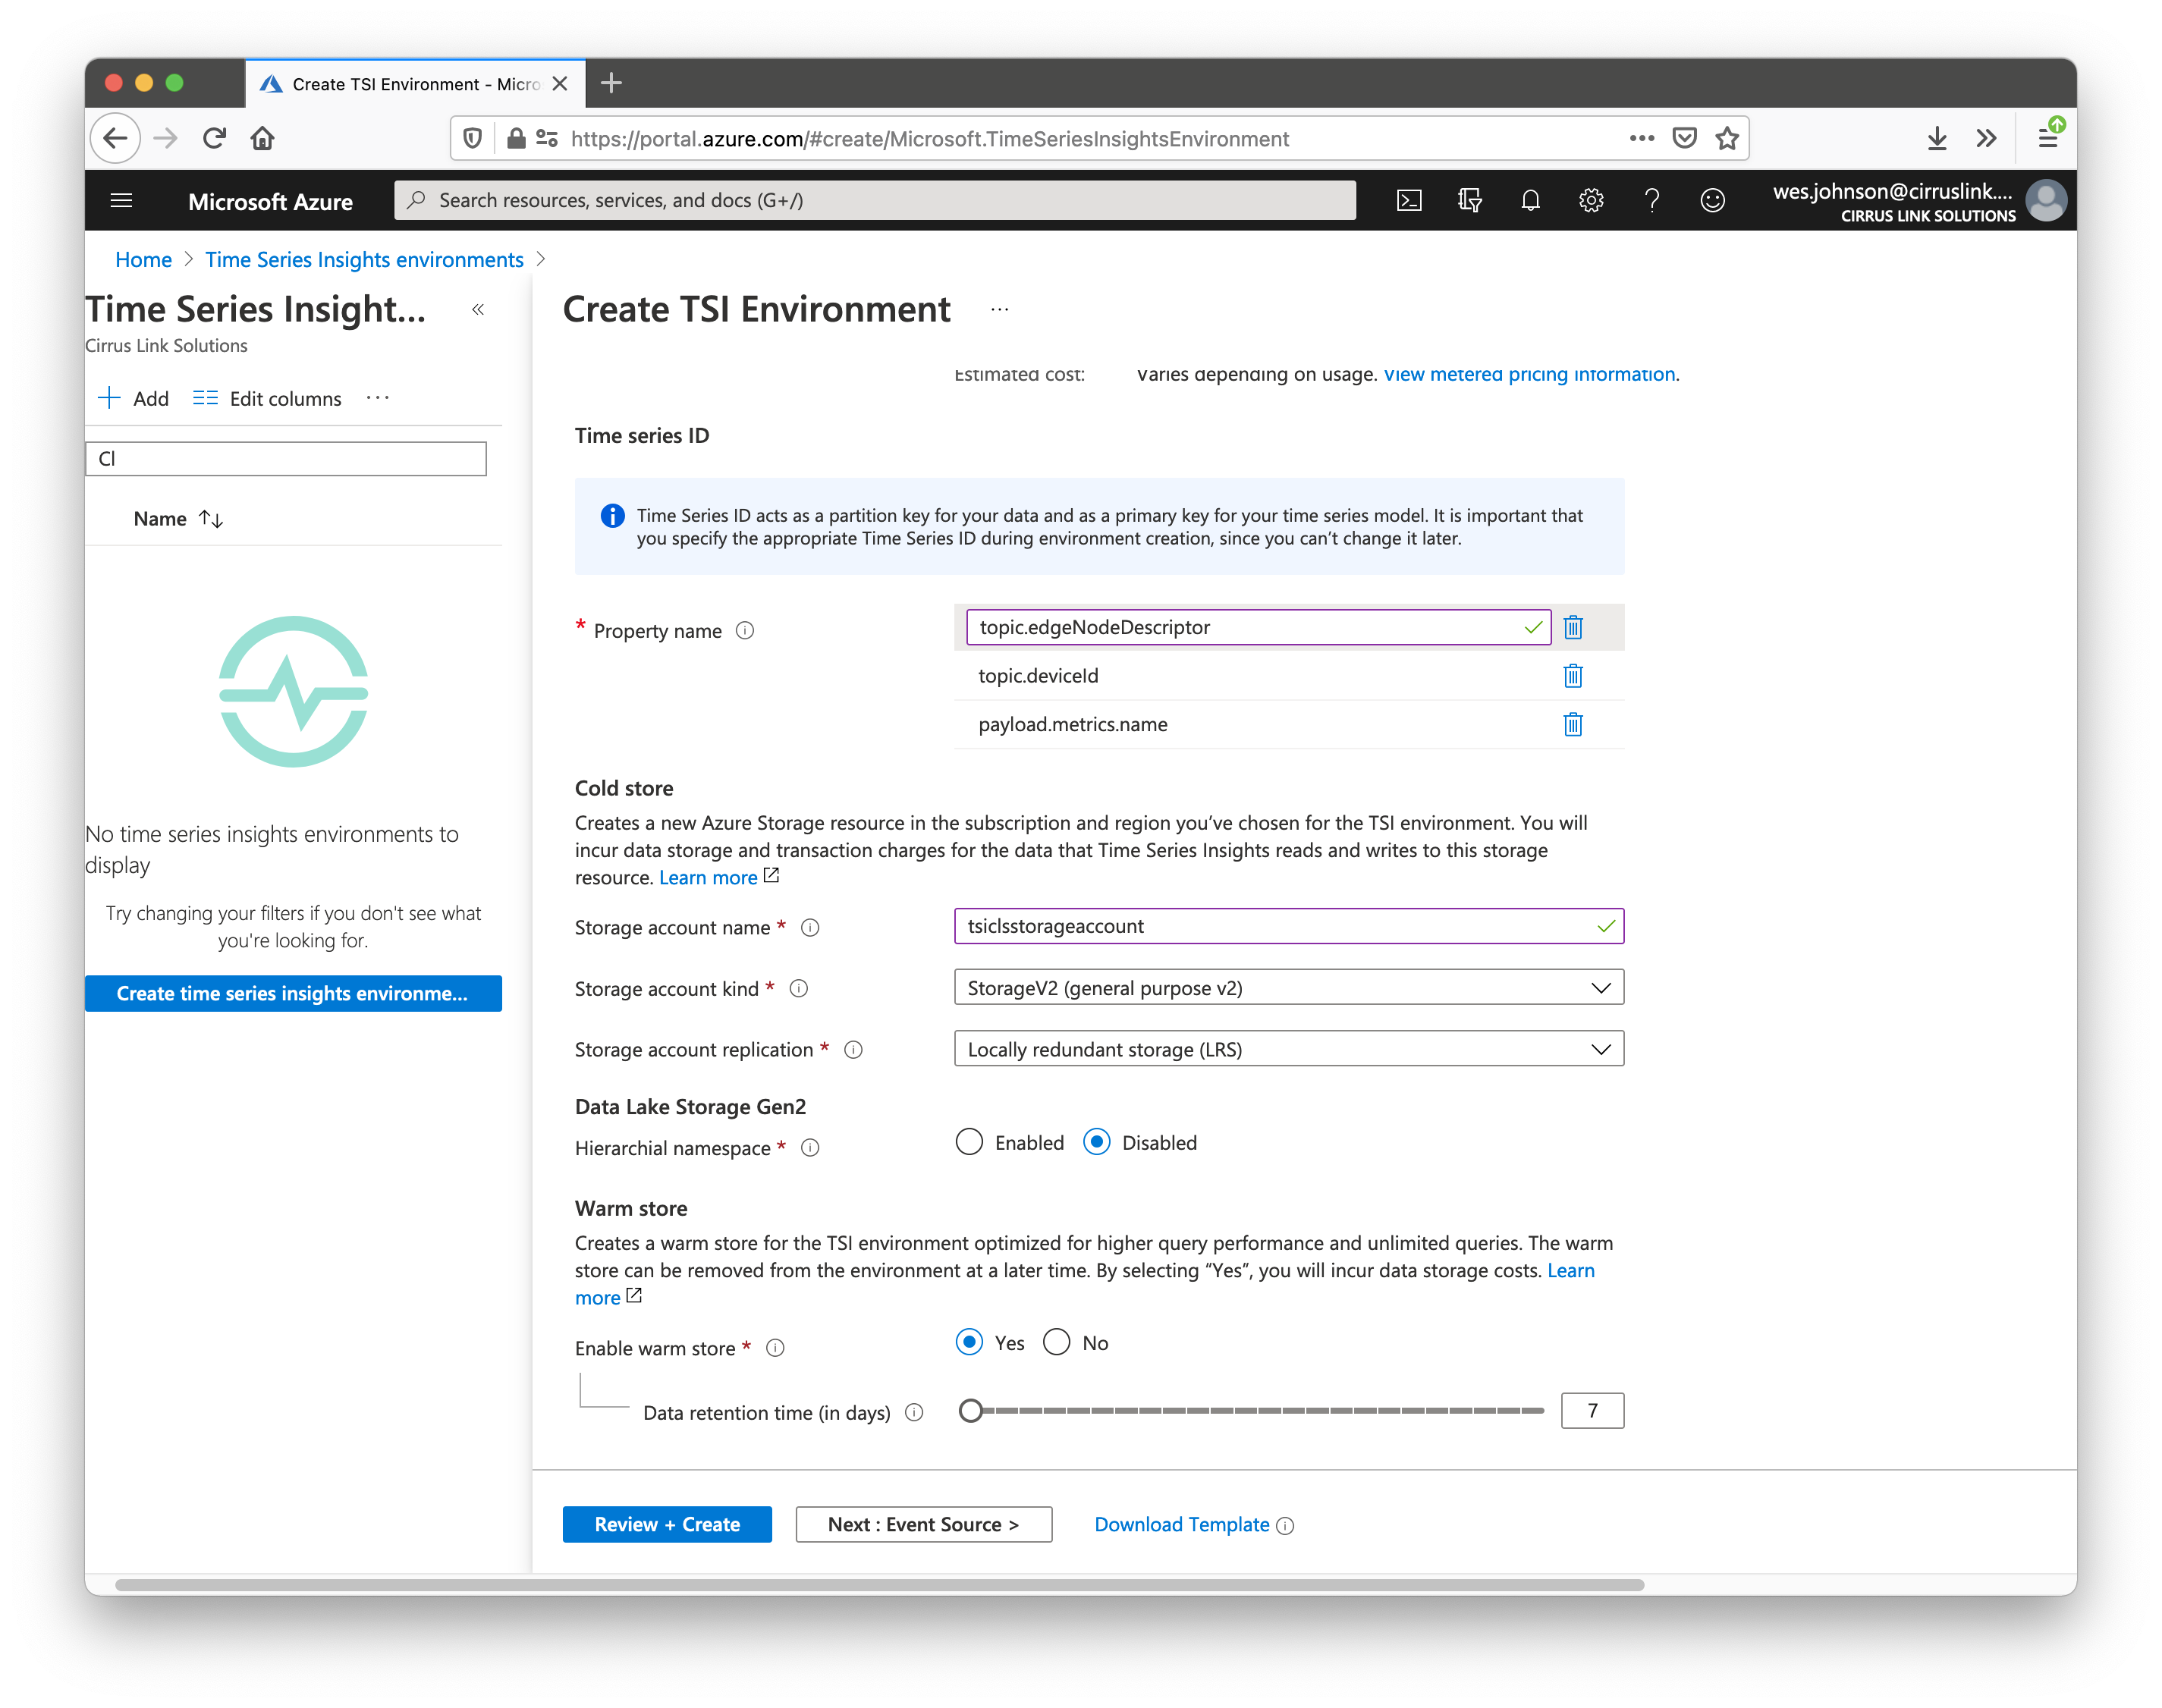
Set three property names as shown above. Set them to:
topic.edgeNodeDescriptor
topic.deviceId
payload.metrics.name
These property names line up with JSON Object members that are pushed to IoT Hub by the Azure Injector module in Ignition.
In addition, set a 'Storage acocunt name' as shown above and leave the other fields default. Now click 'Next: Event Source'. After doing so, you should see the following.
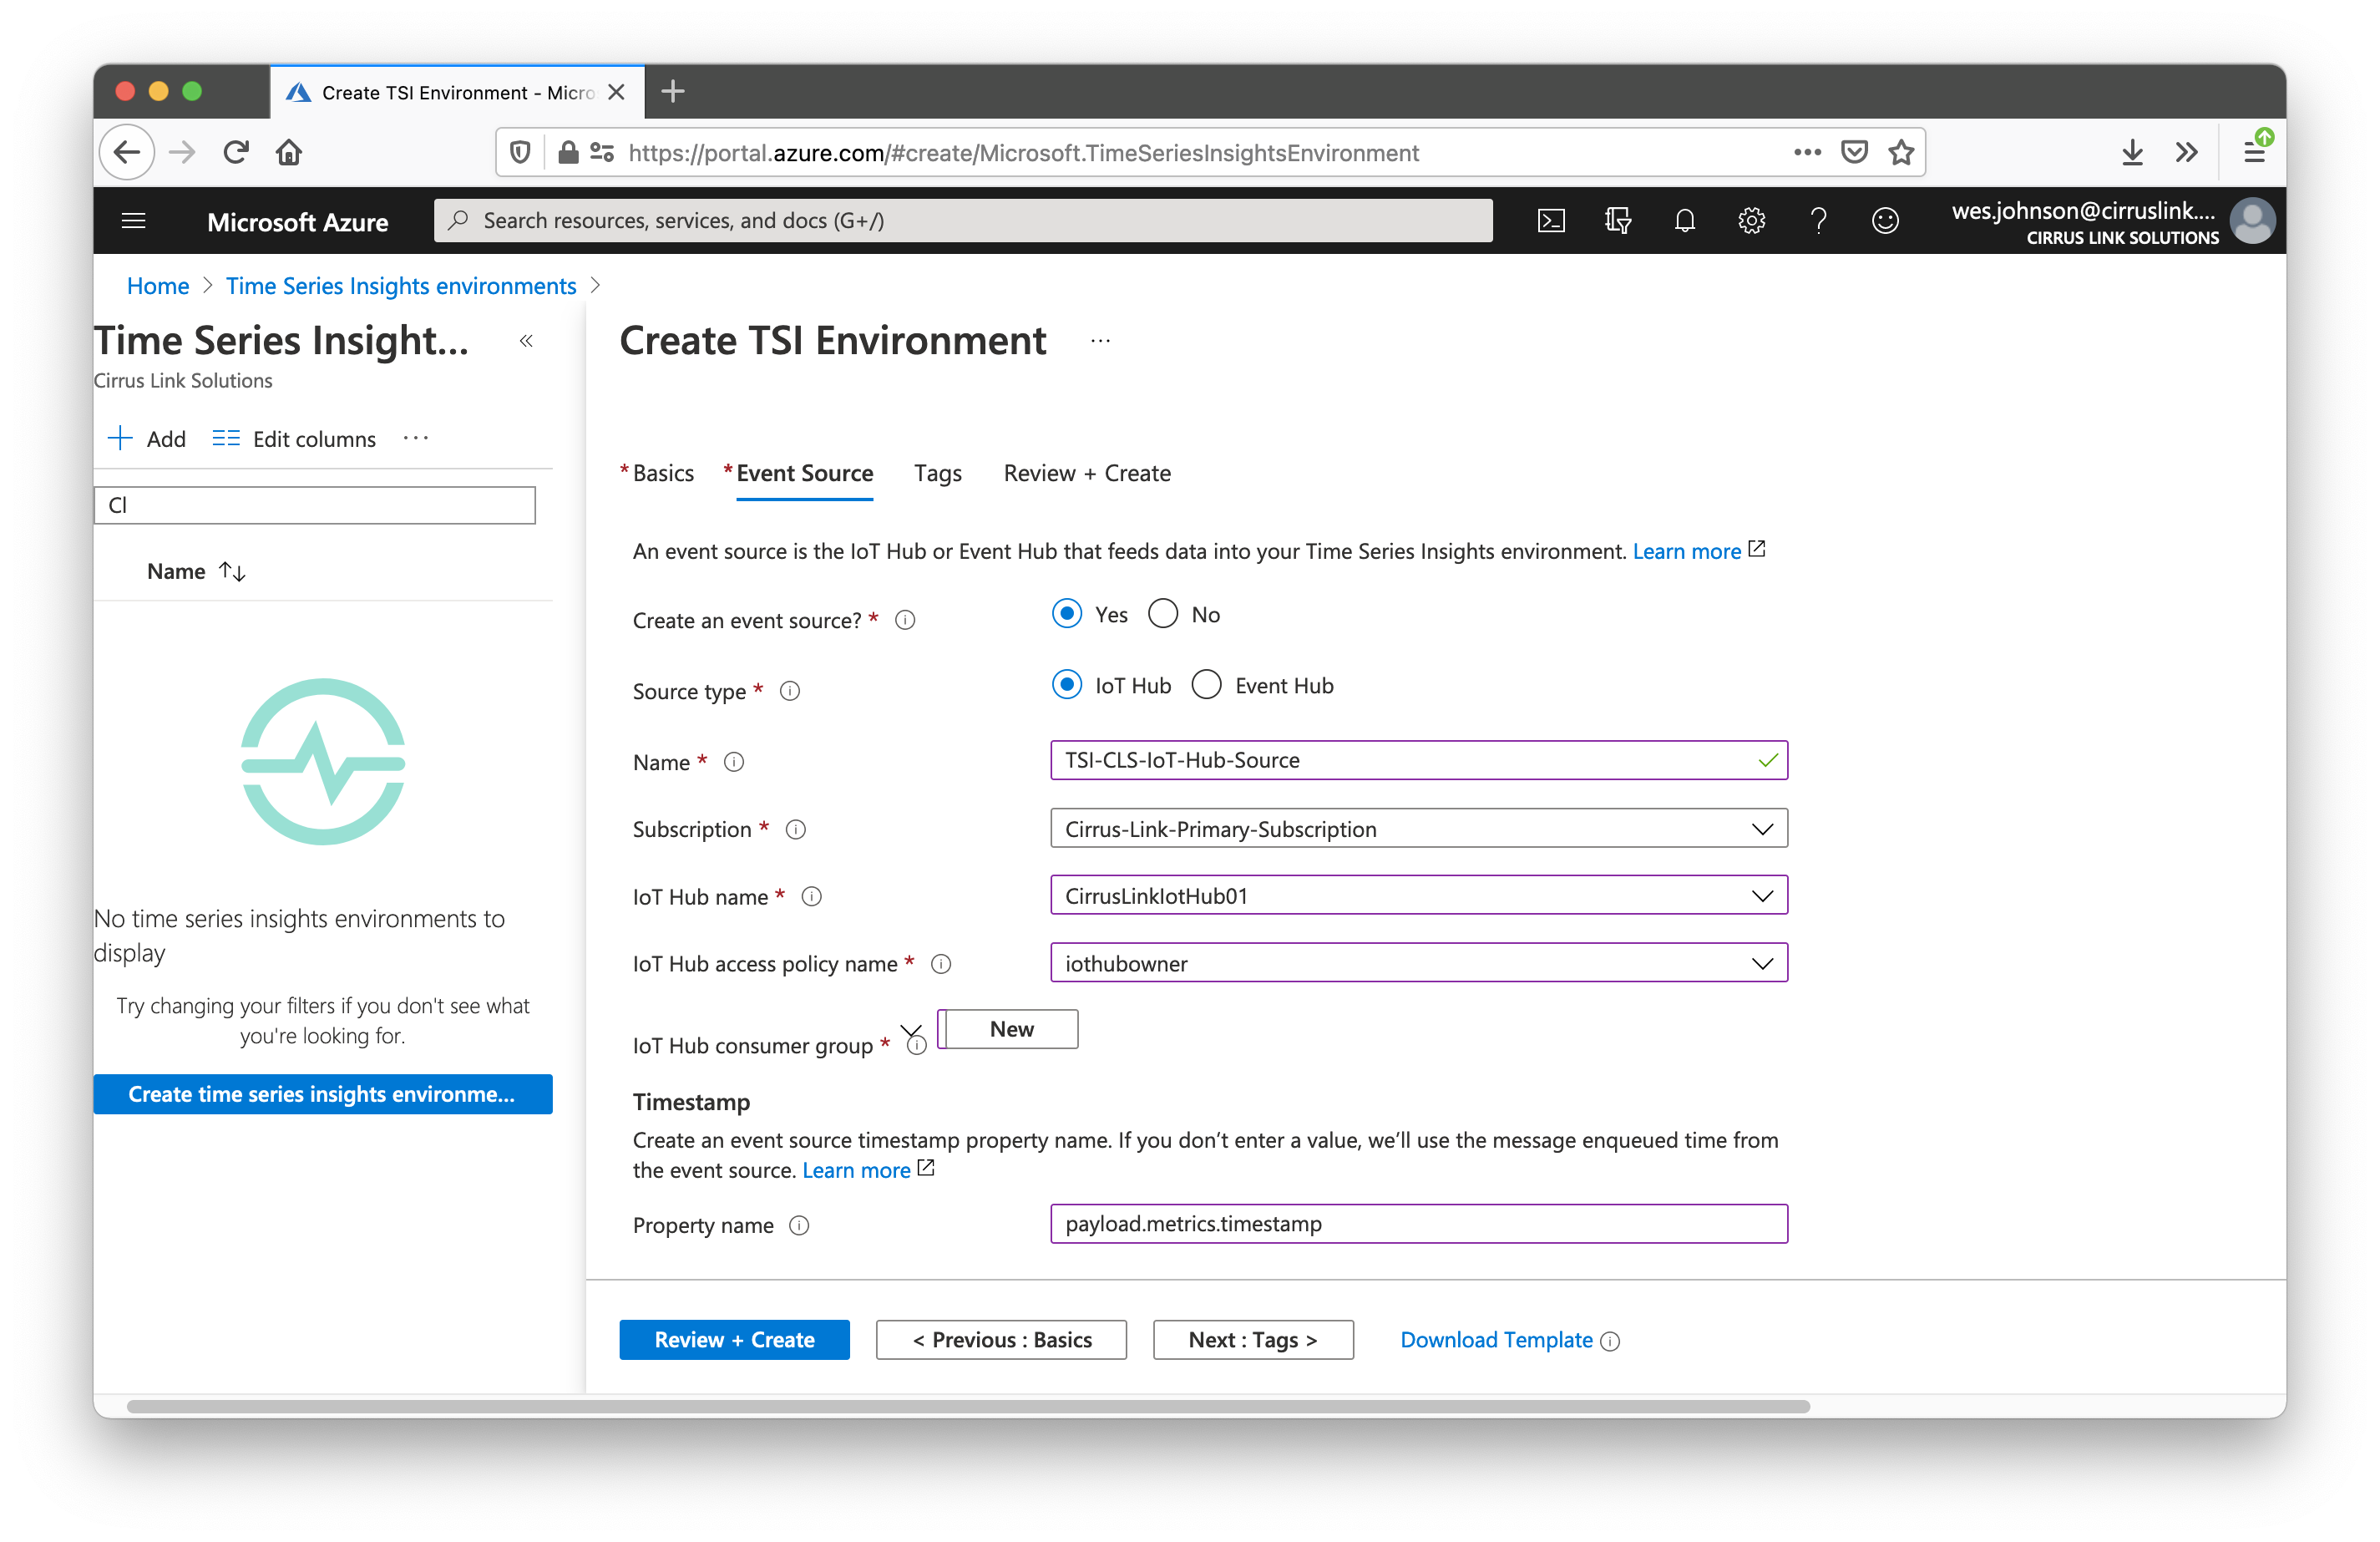
As shown above, set the Name, Subscription, IoT Hub name, IoT Hub access policy name, IoT Hub consumer group, and set the timestamp property name to 'payload.metrics.timestamp'. This will tell Time Series Insights to use the incoming timestamp for the tag value to be used as the timestamp to store in the time series database. Finally, click 'Review + Create'. This will show something similar to the following.
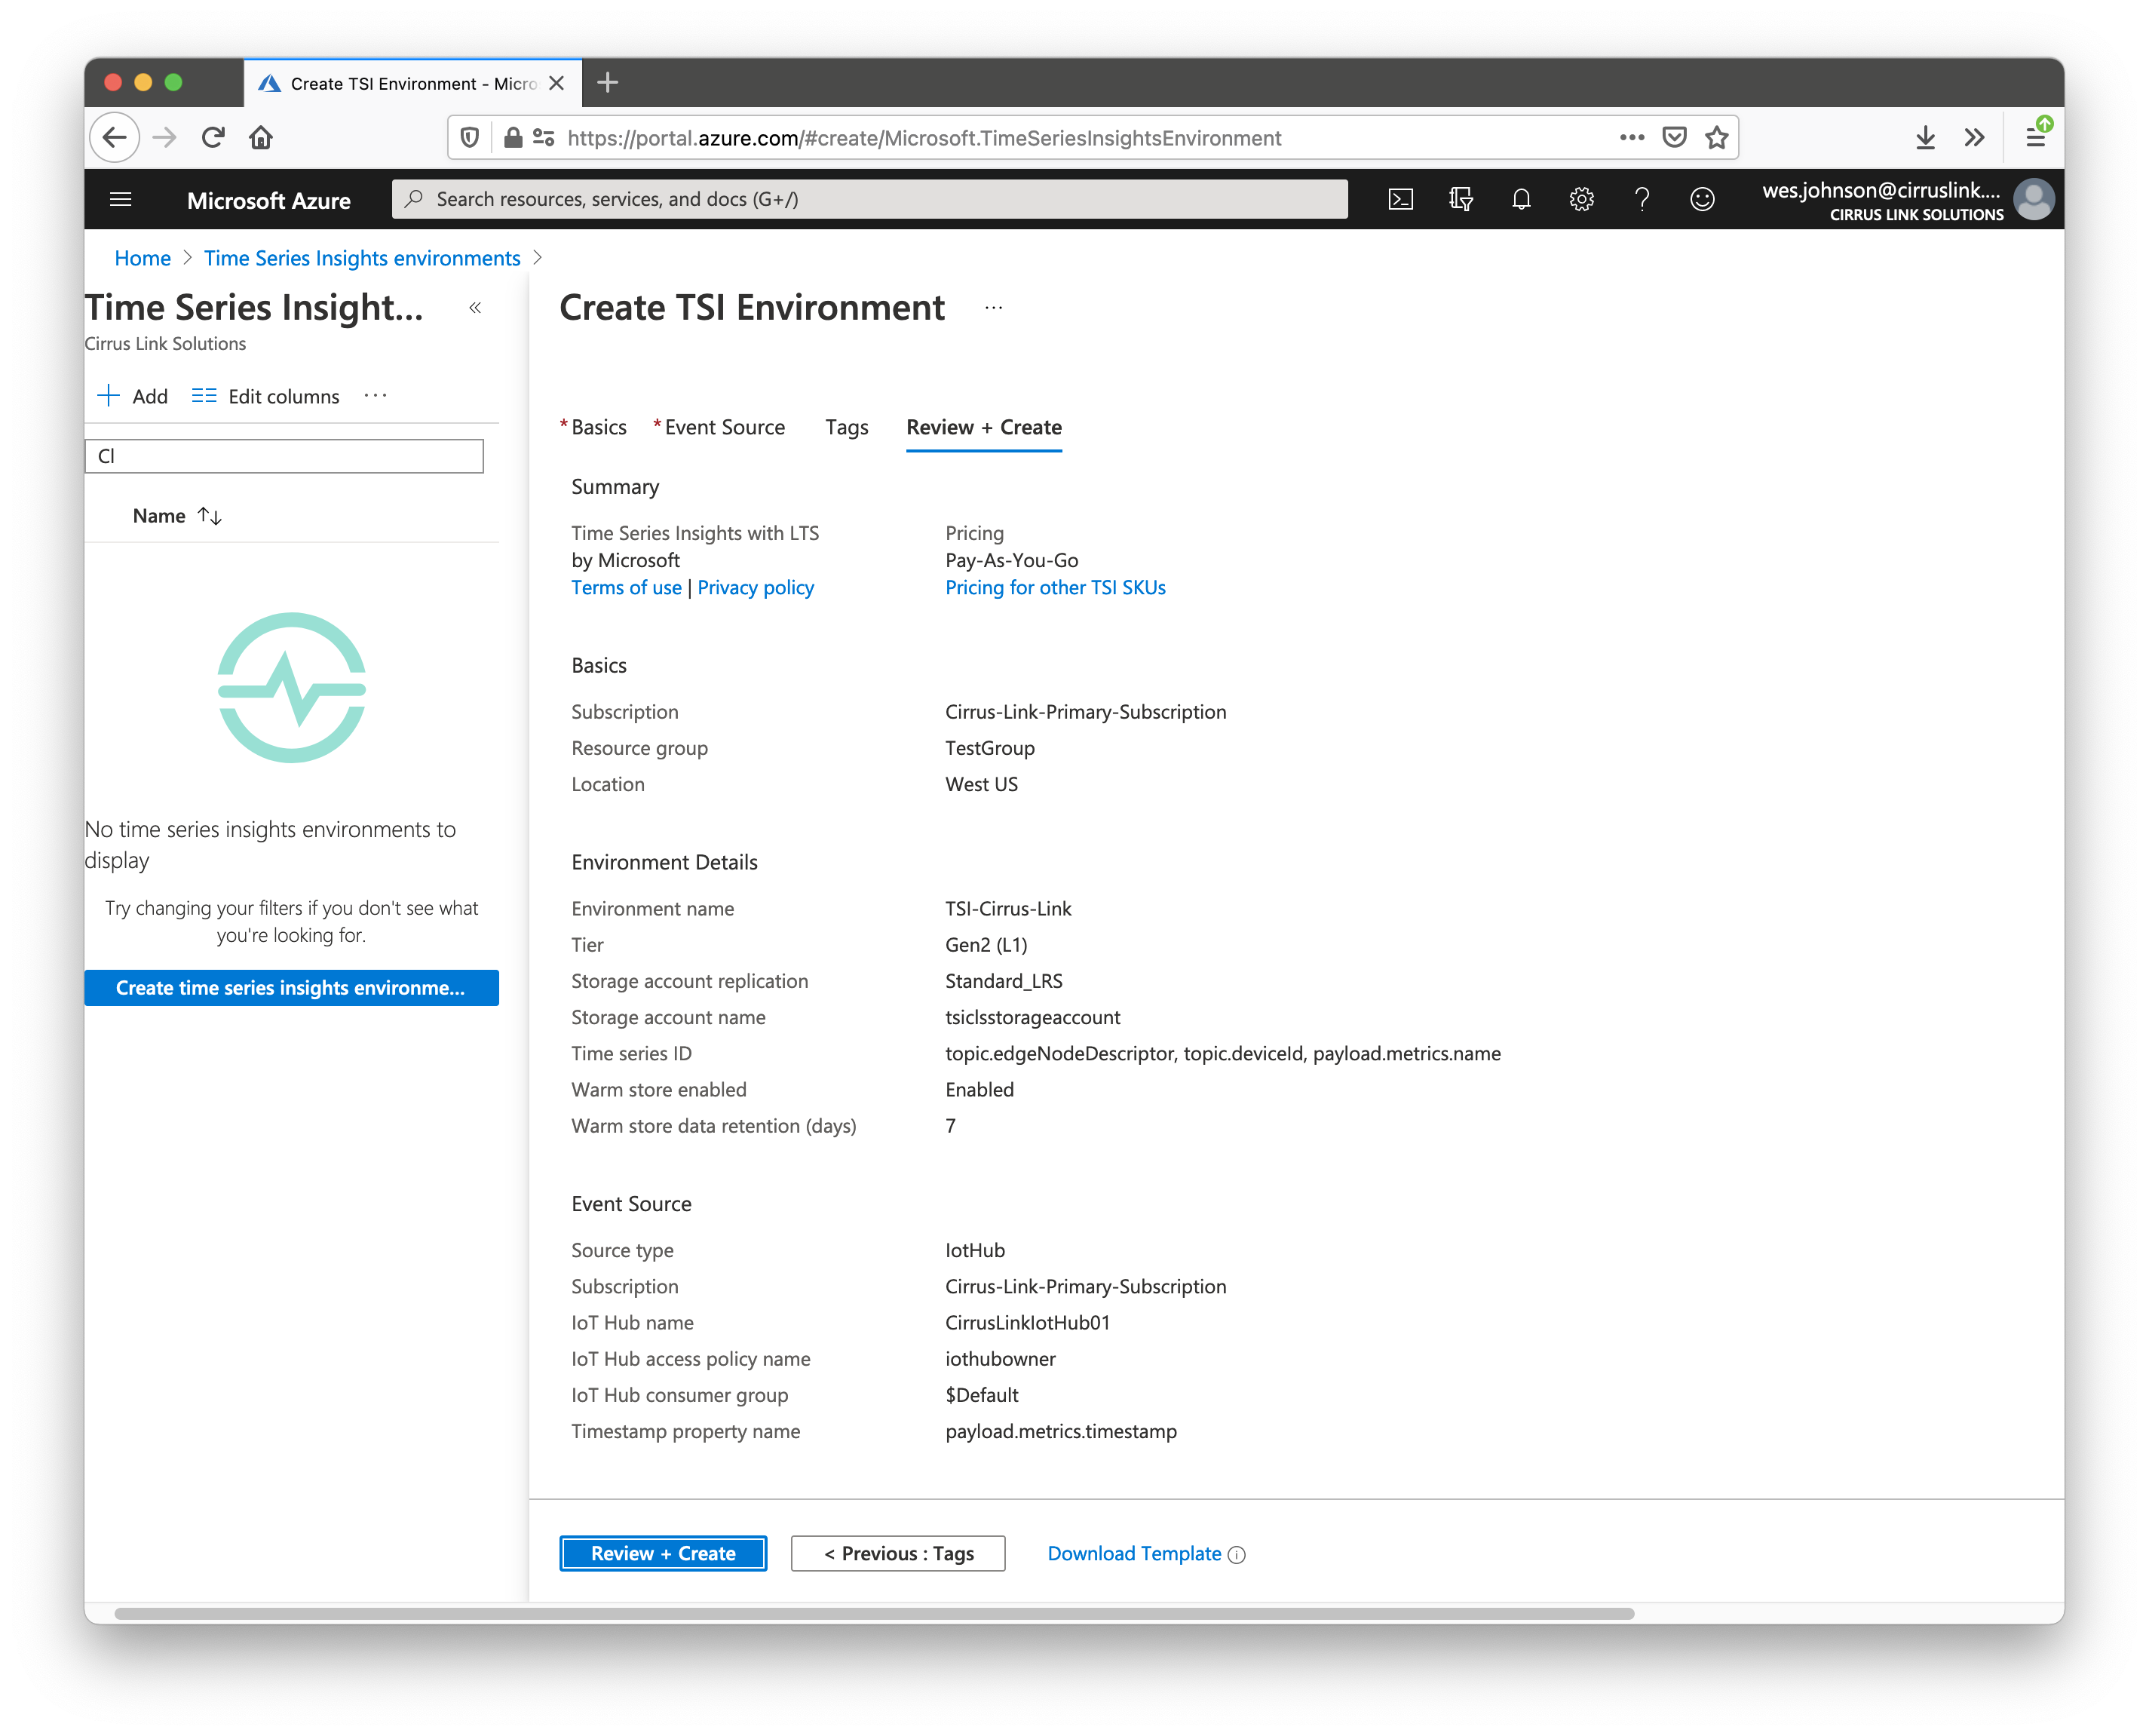
Finally click 'Review + Create' to create the new Time Series Environment. This will take a few minutes to complete. When creation is complete, you should see the following.
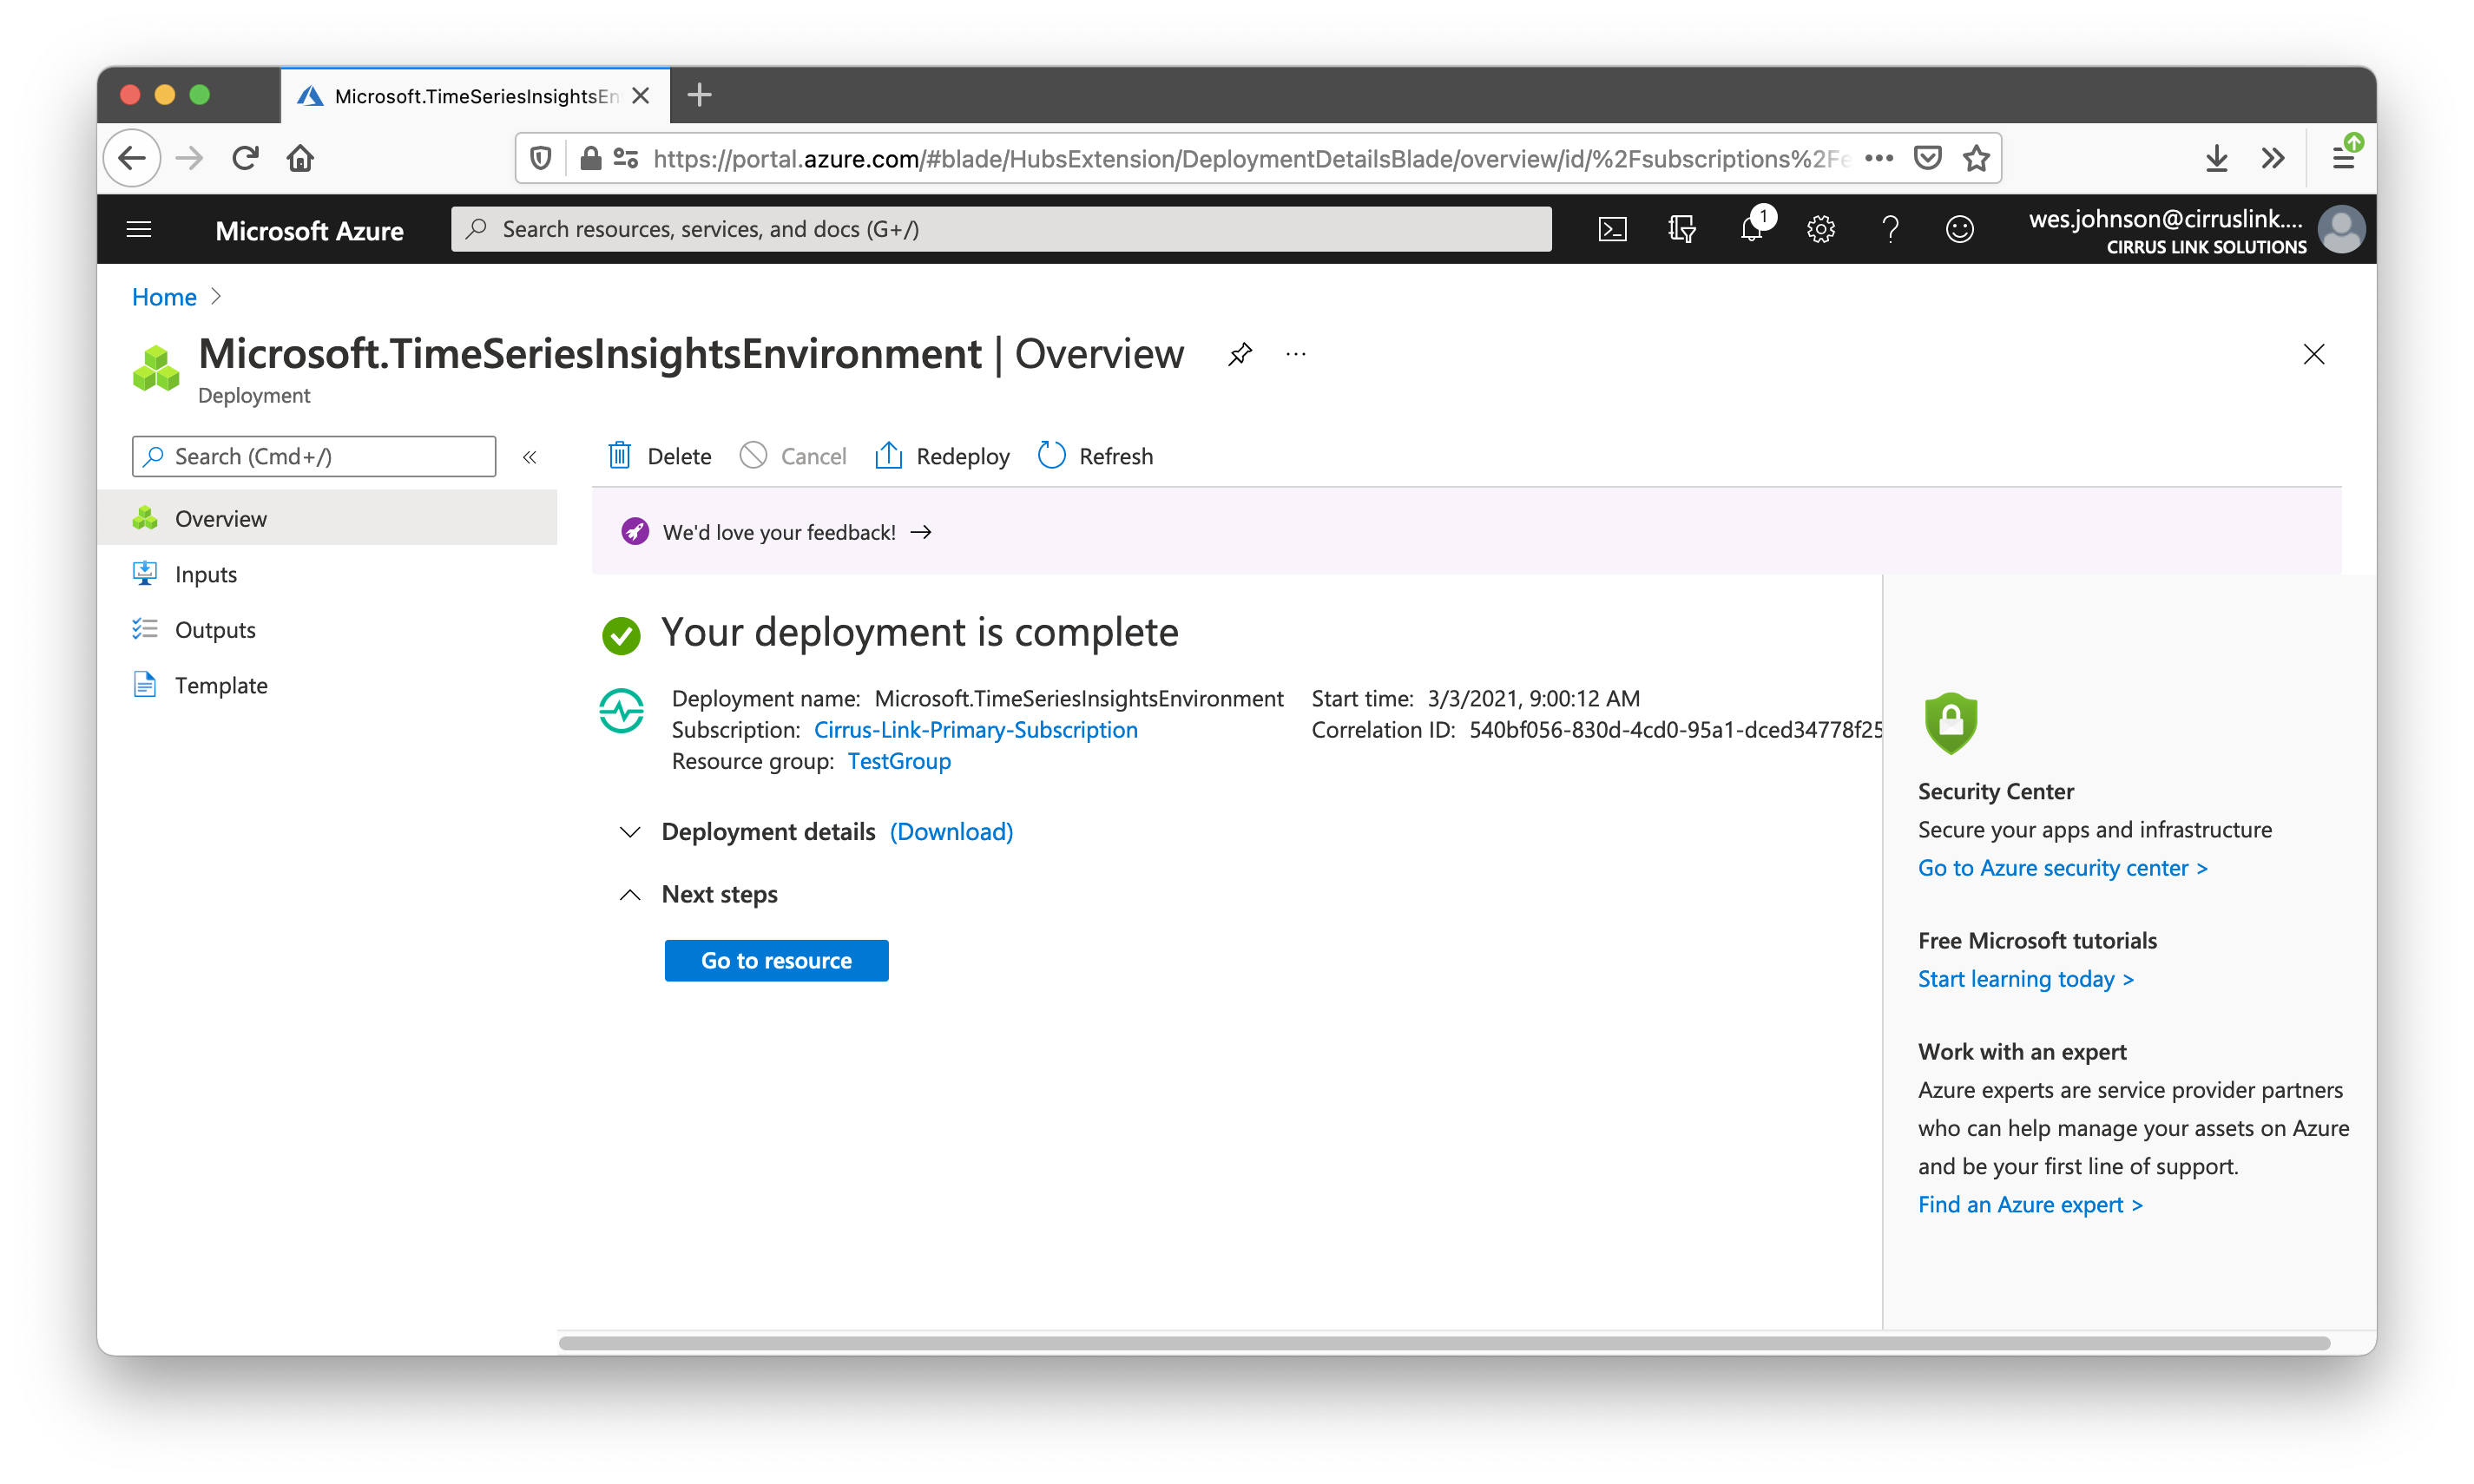
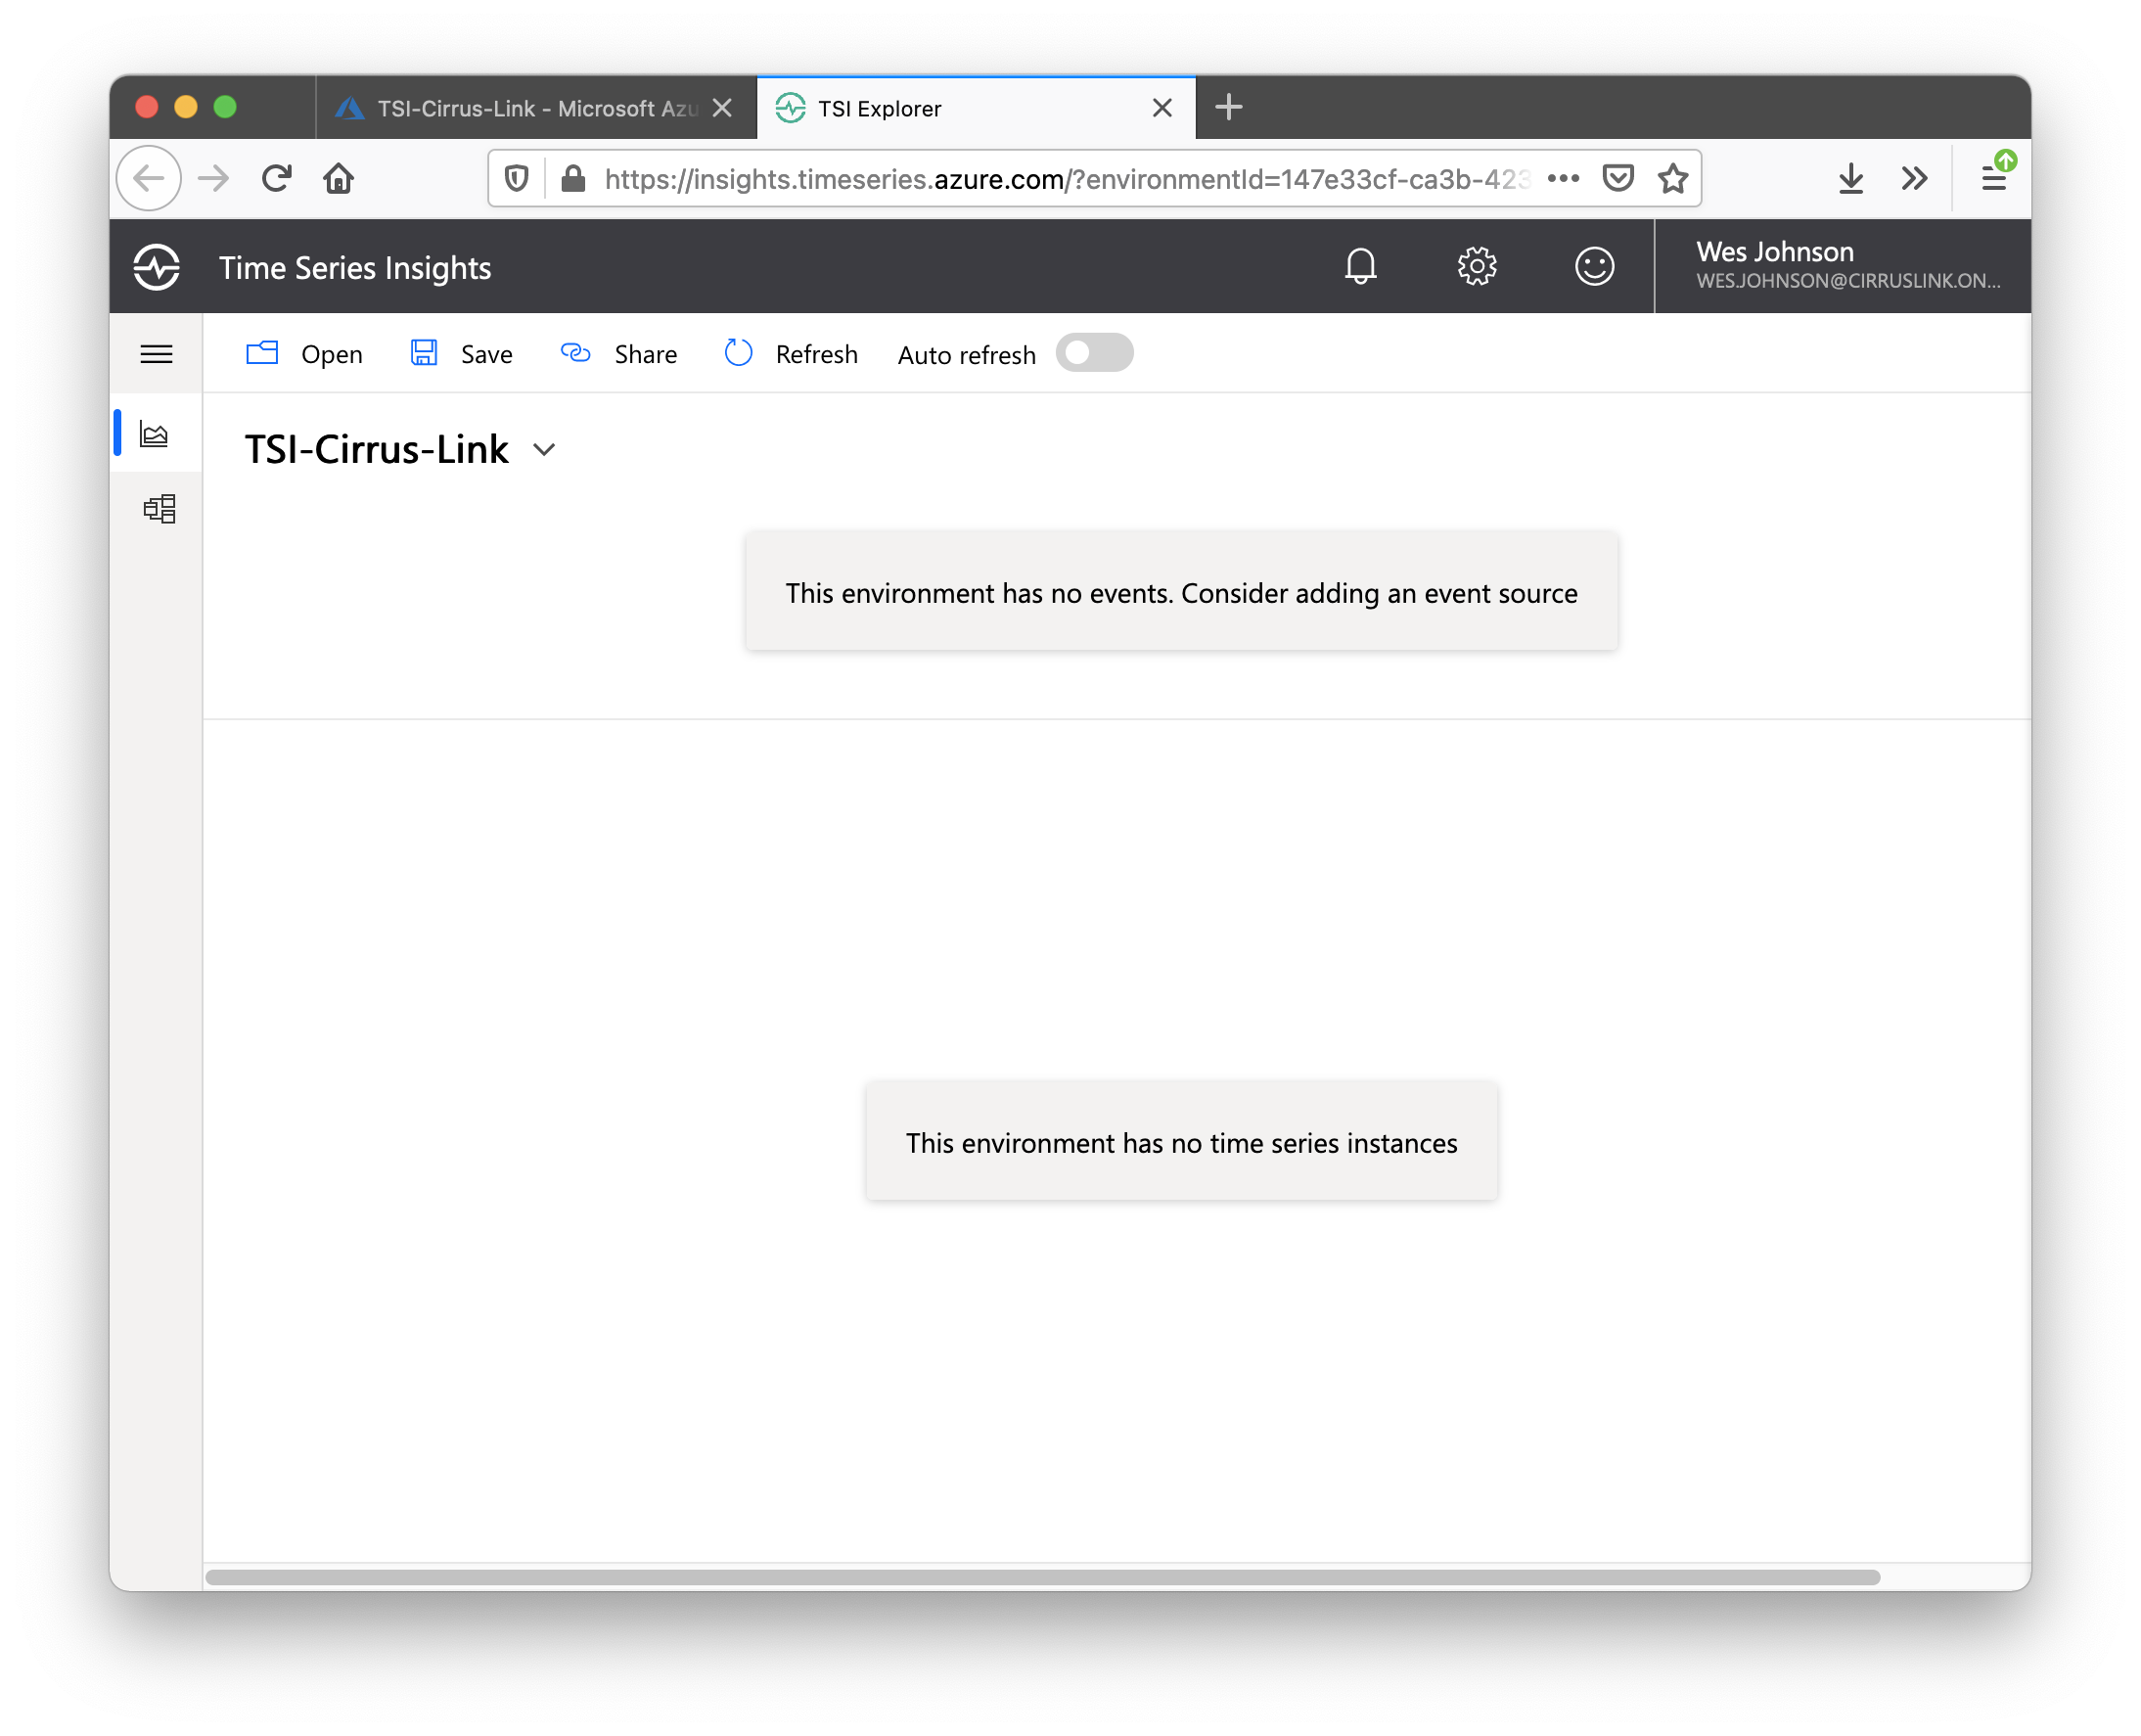
Click 'Go to resource' to see the new Time Series Insights Environment. When viewing the newly created Time Series Insights Environment, there is a 'Go to TSI Explorer' button near the top of the main panel. Click this. After doing so, you should see something similar to the following:
On the left navigation panel, click the 'model' tab. Then select 'Hierarchies' on the top as shown below.
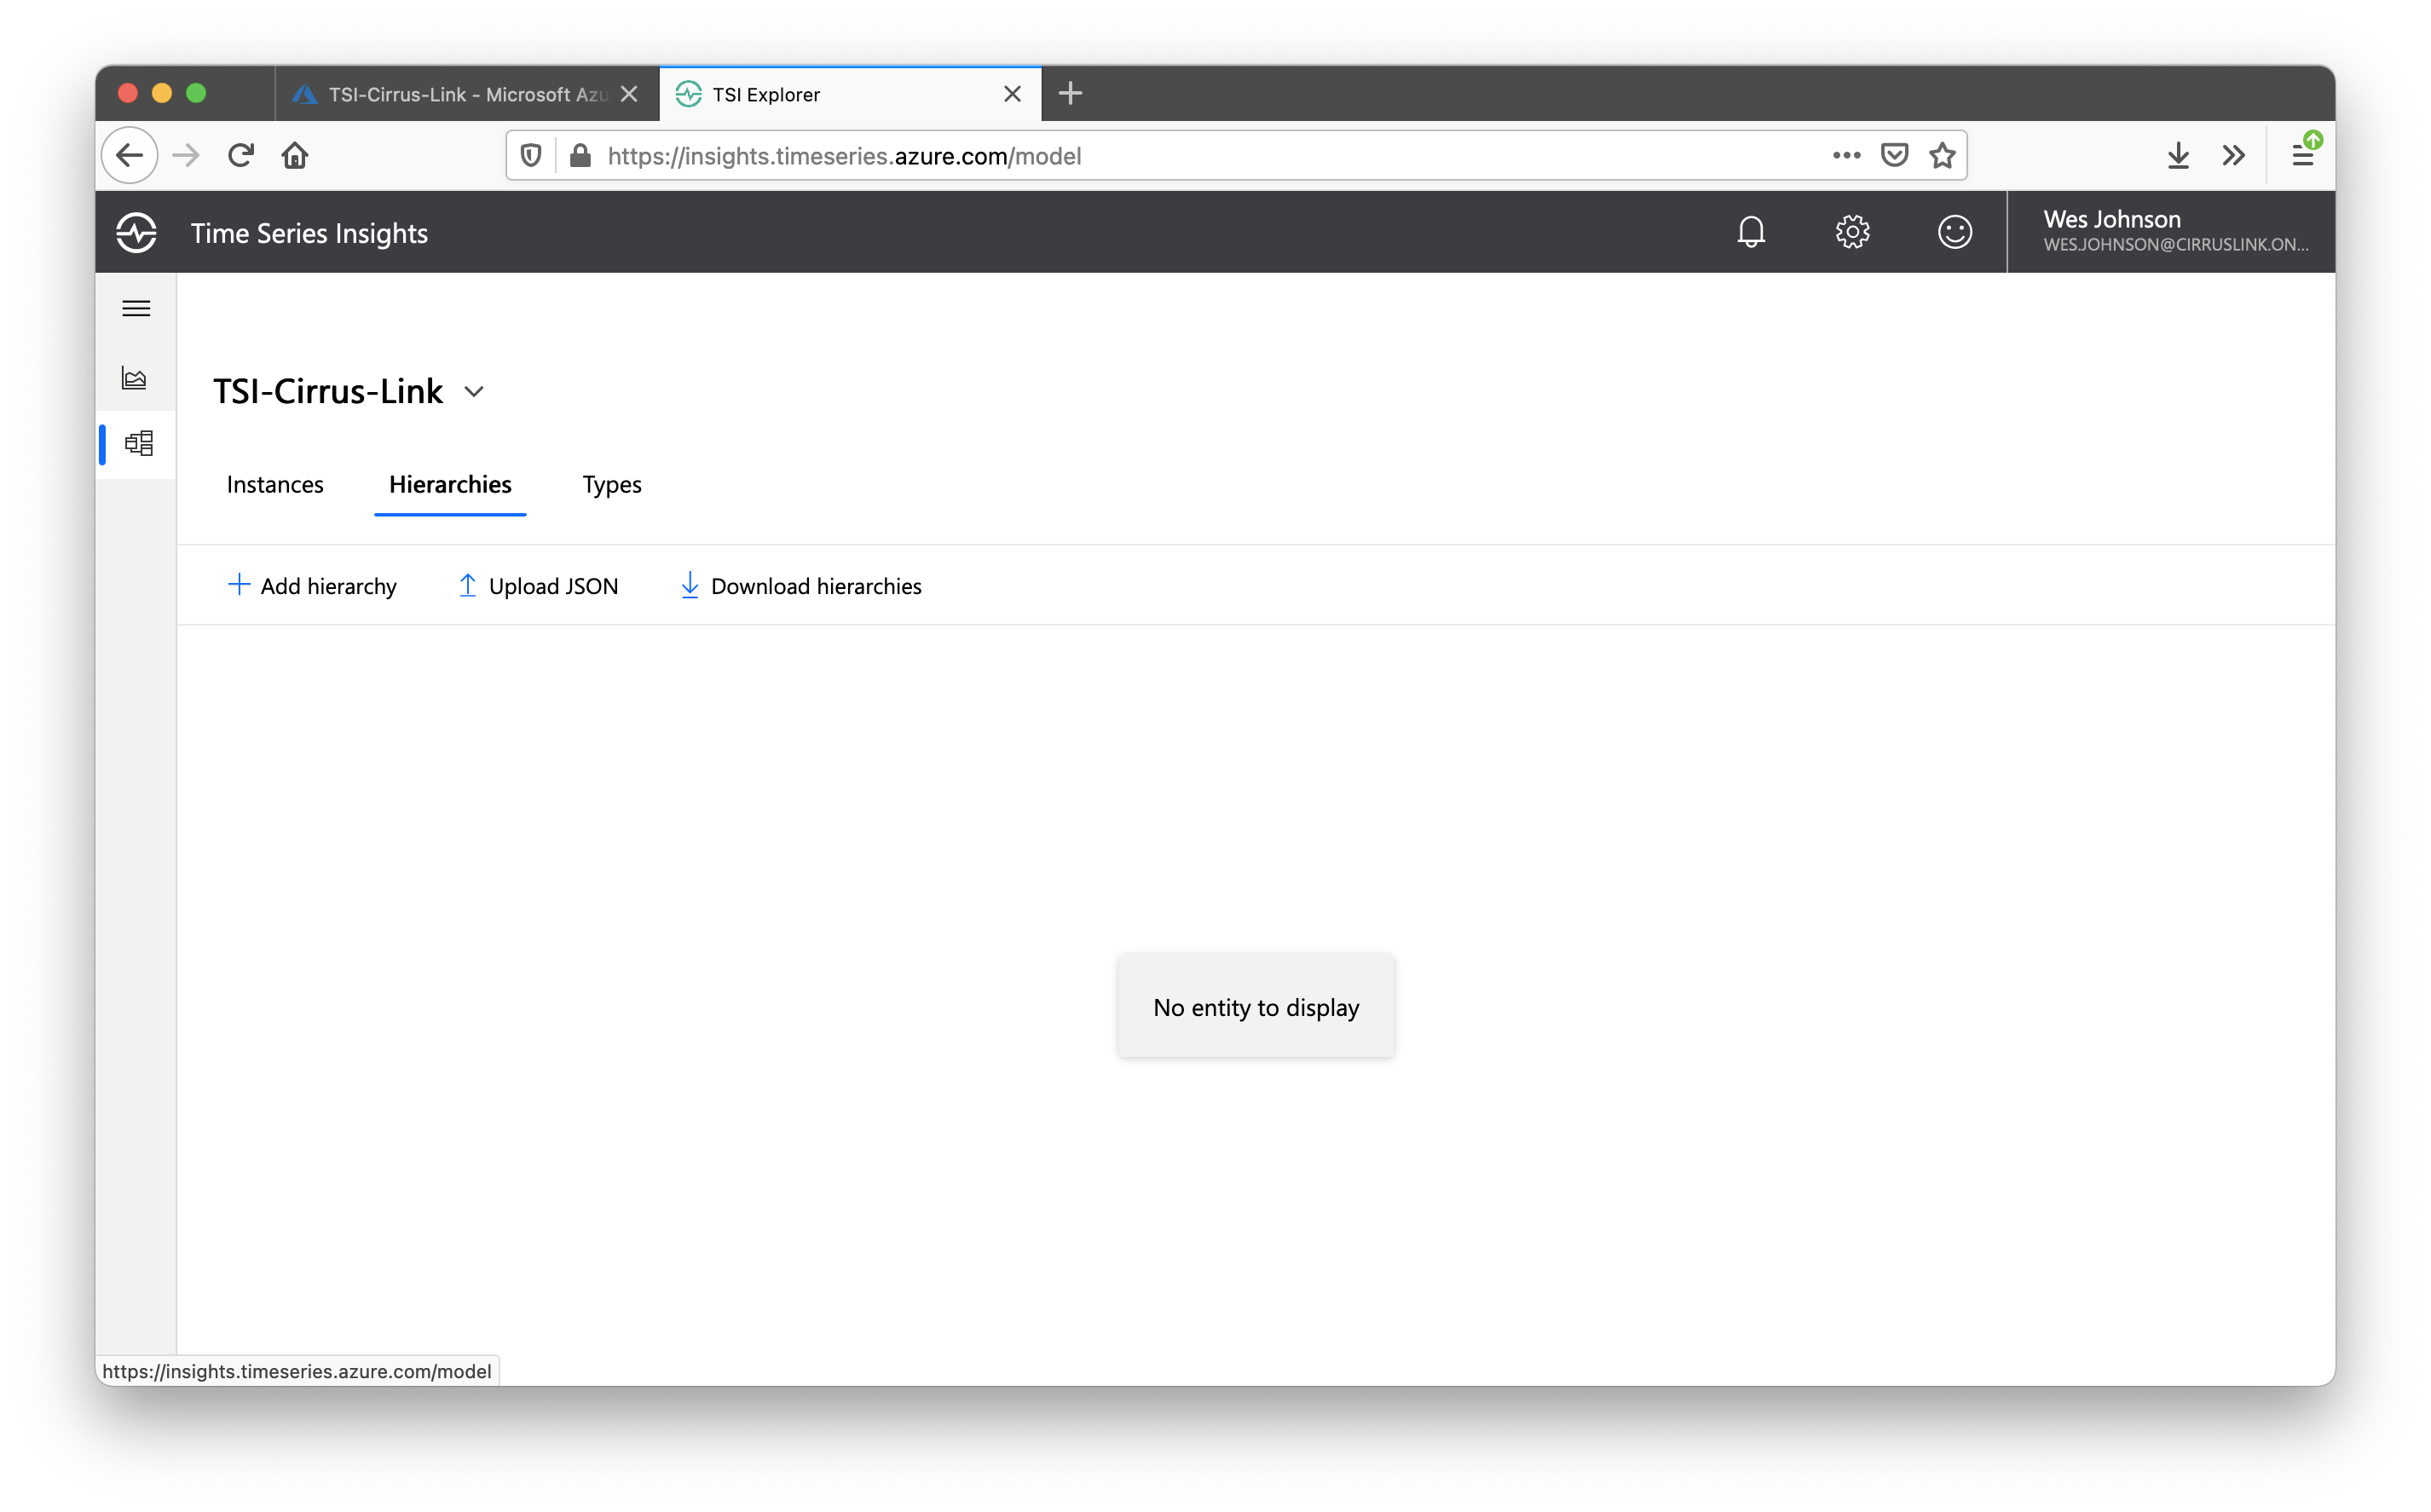
Now click '+ Add hierarchy' in the upper left of the main panel. This will open a new screen to add the new hierarchy as shown below.
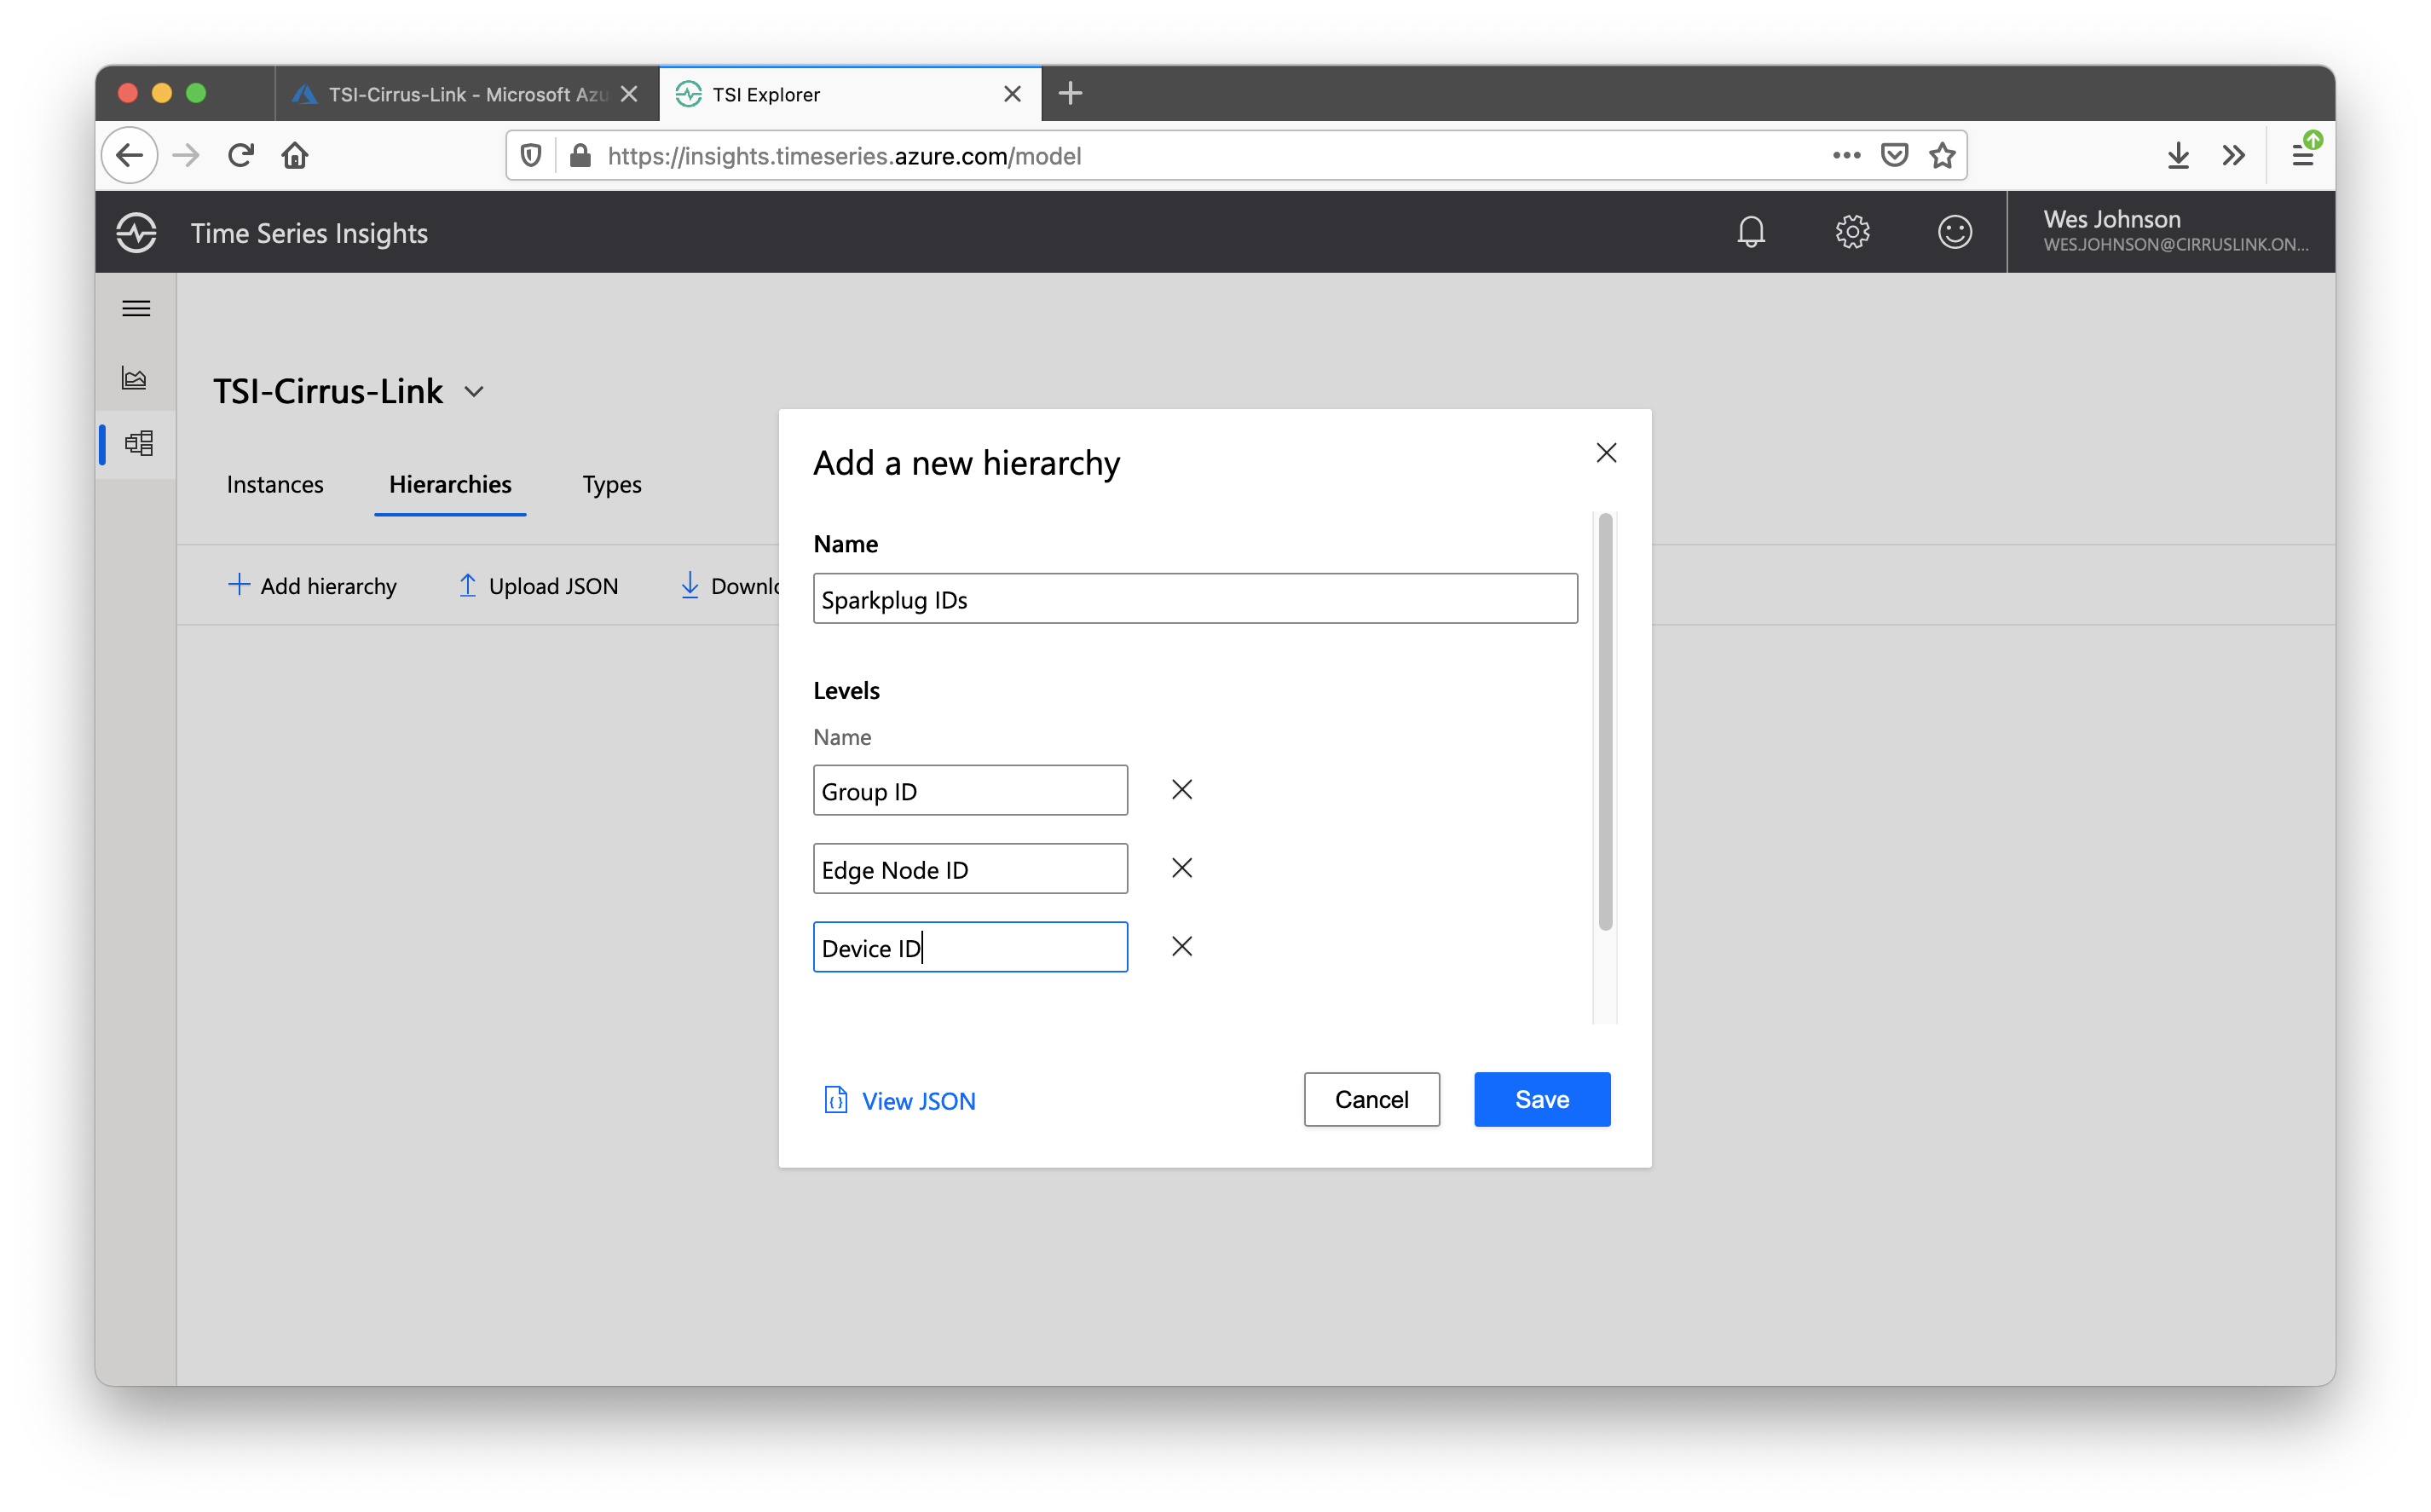
Set the Name to 'Sparkplug IDs' and create three levels of 'Group ID', 'Edge Node ID', and 'Device ID' as shown above. Then click 'Save' to save the new hierarchy. You should now see the following newly created hierarchy as shown below.
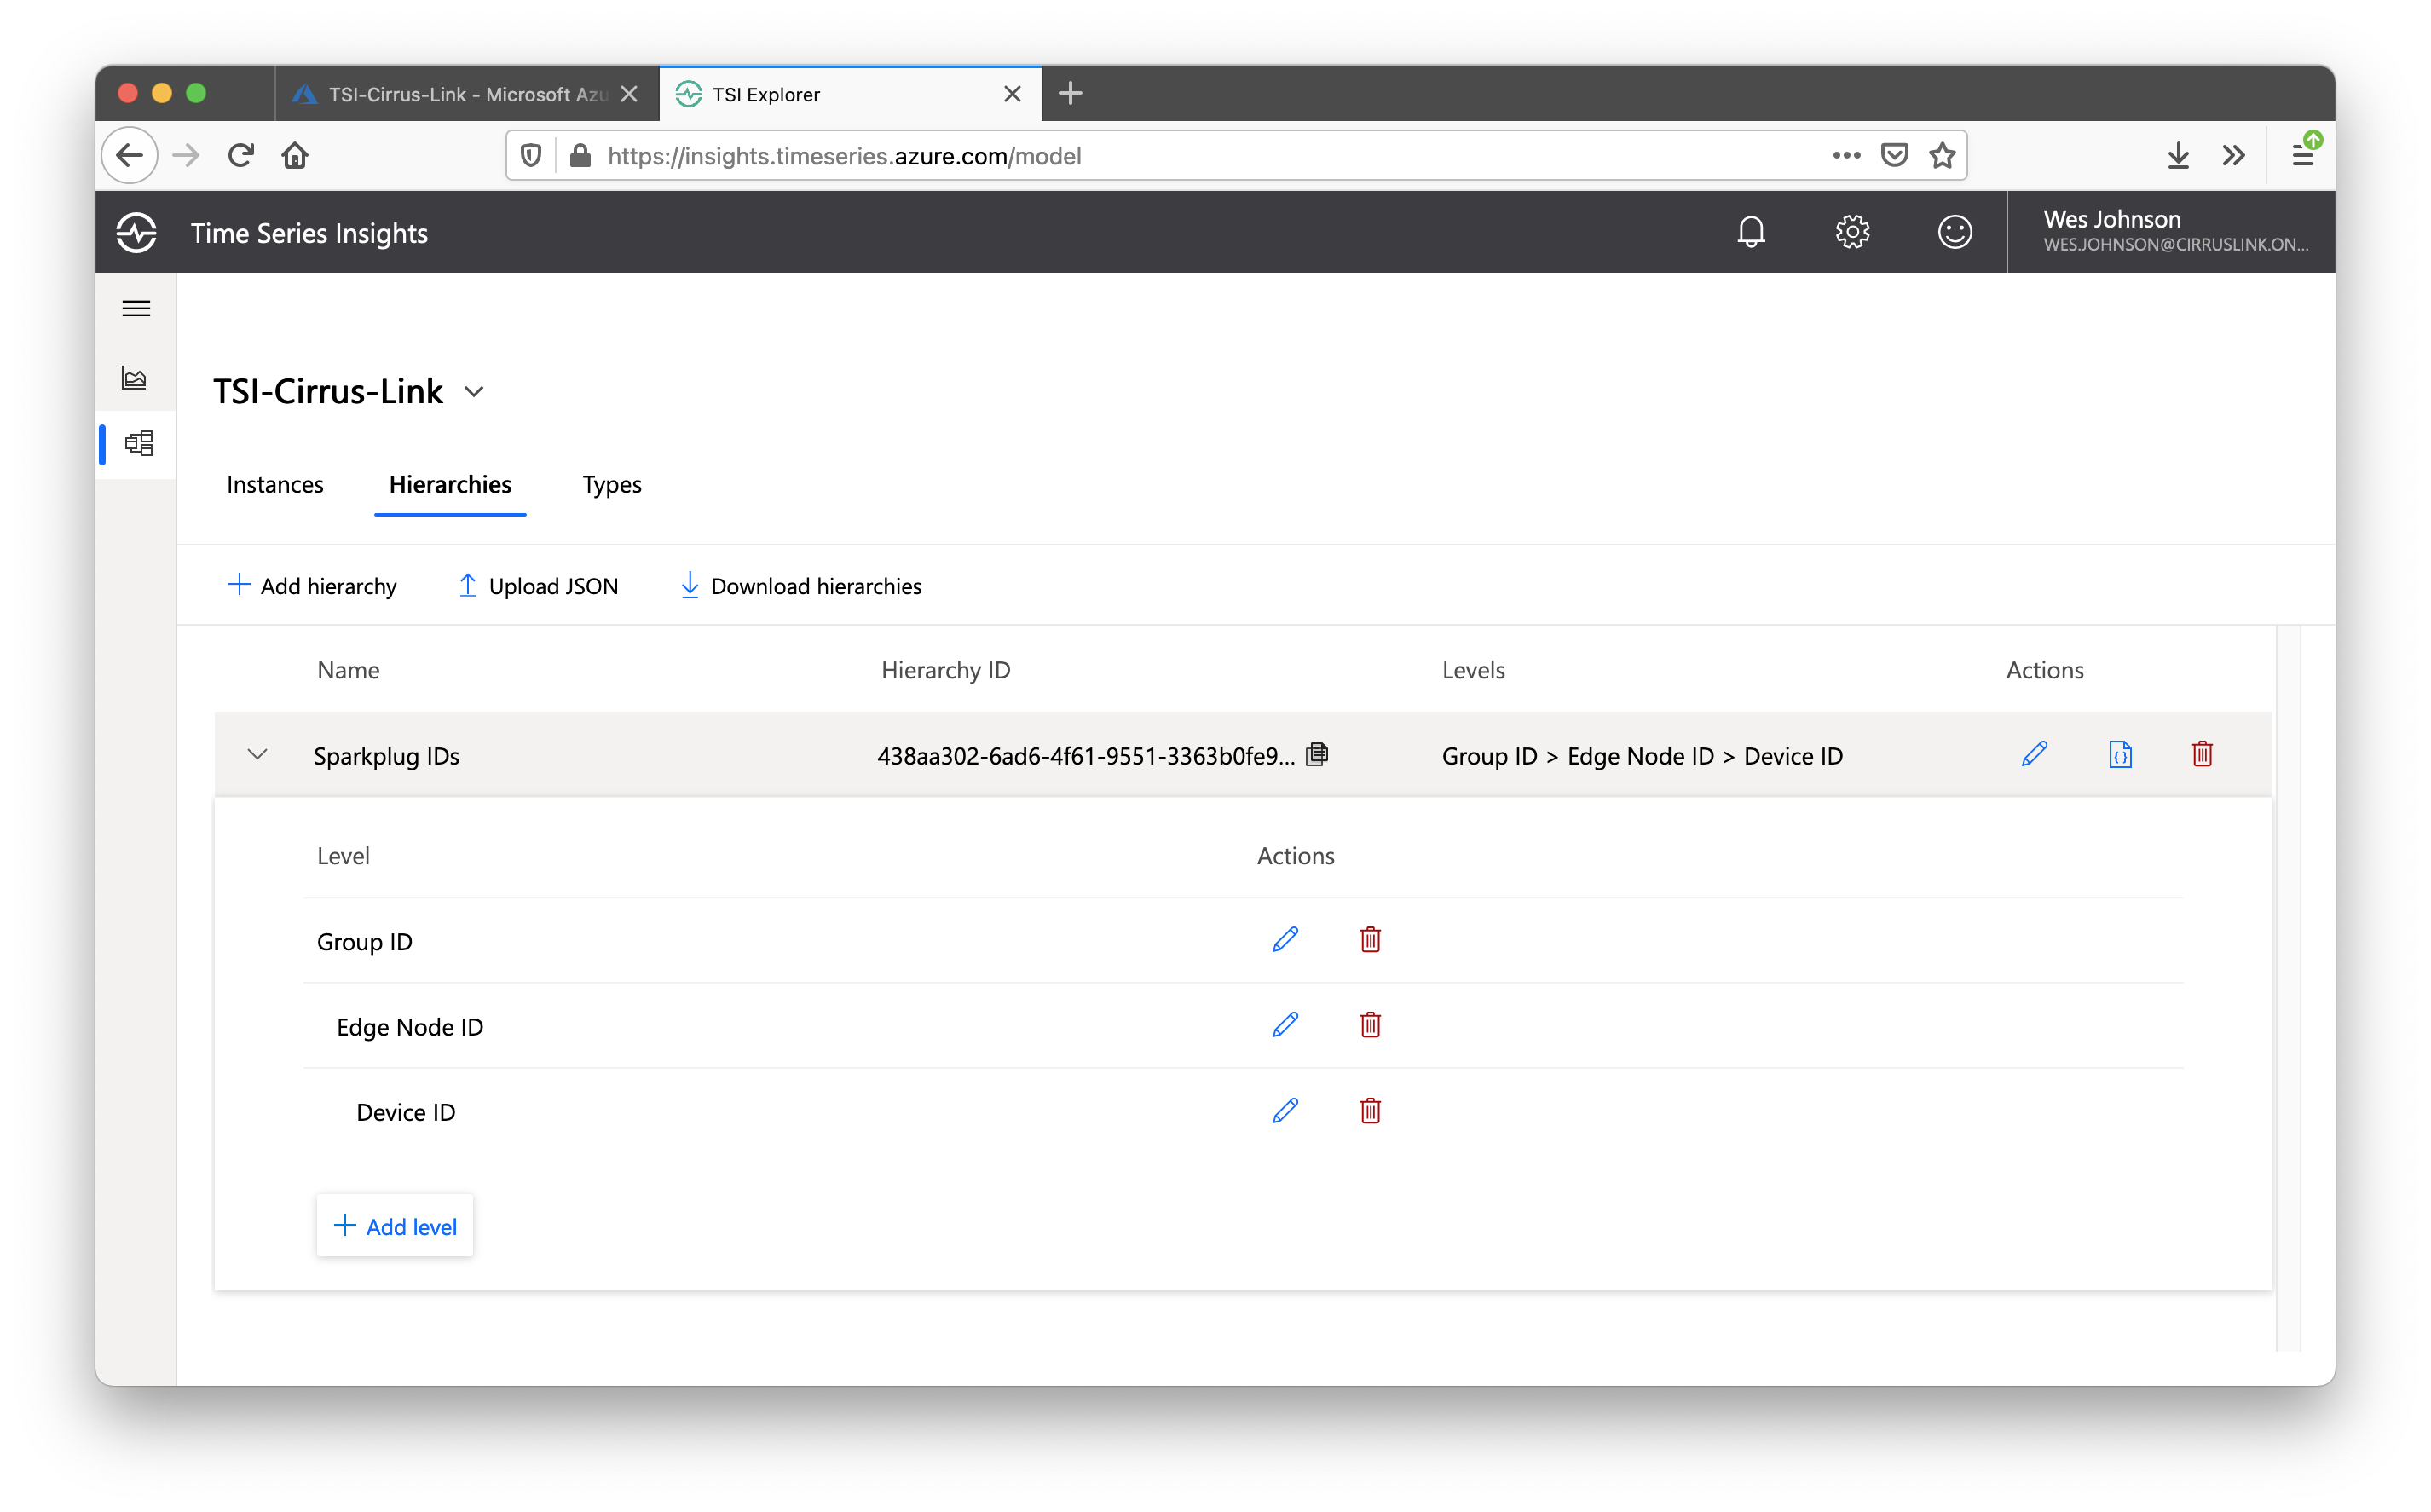
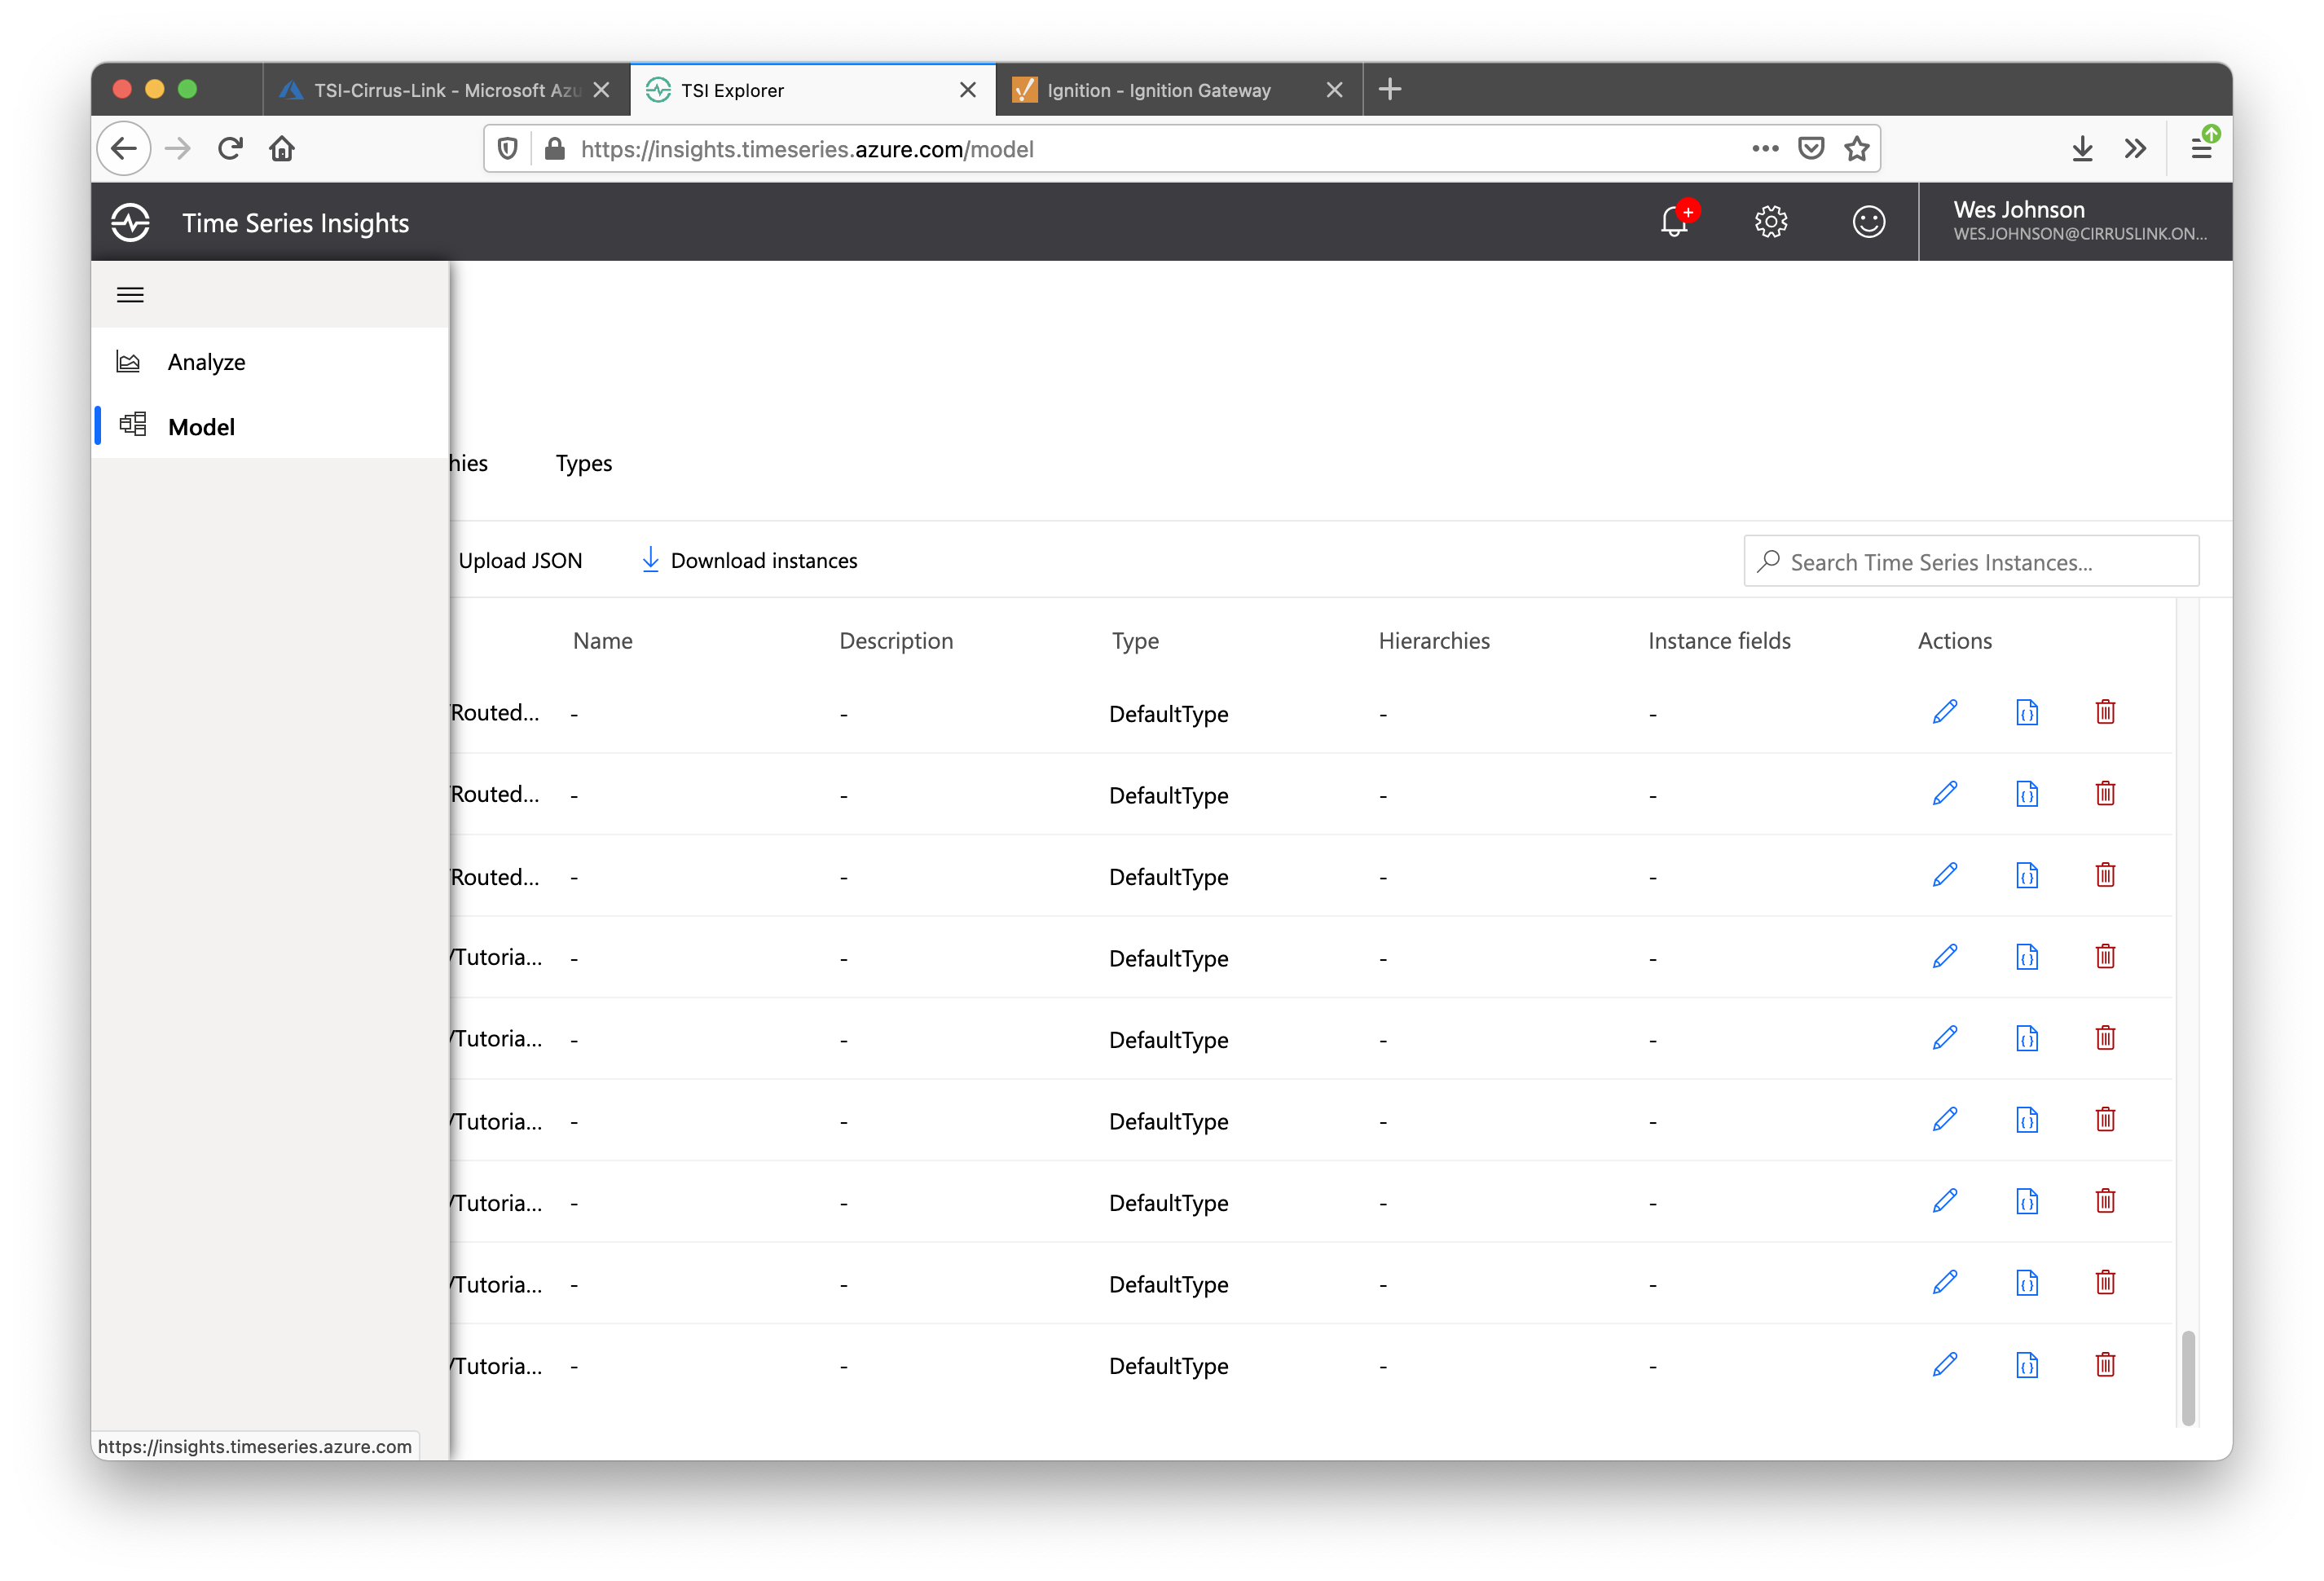
Now click the 'Types' tab new the top of the main panel. You should see something similar to the following.
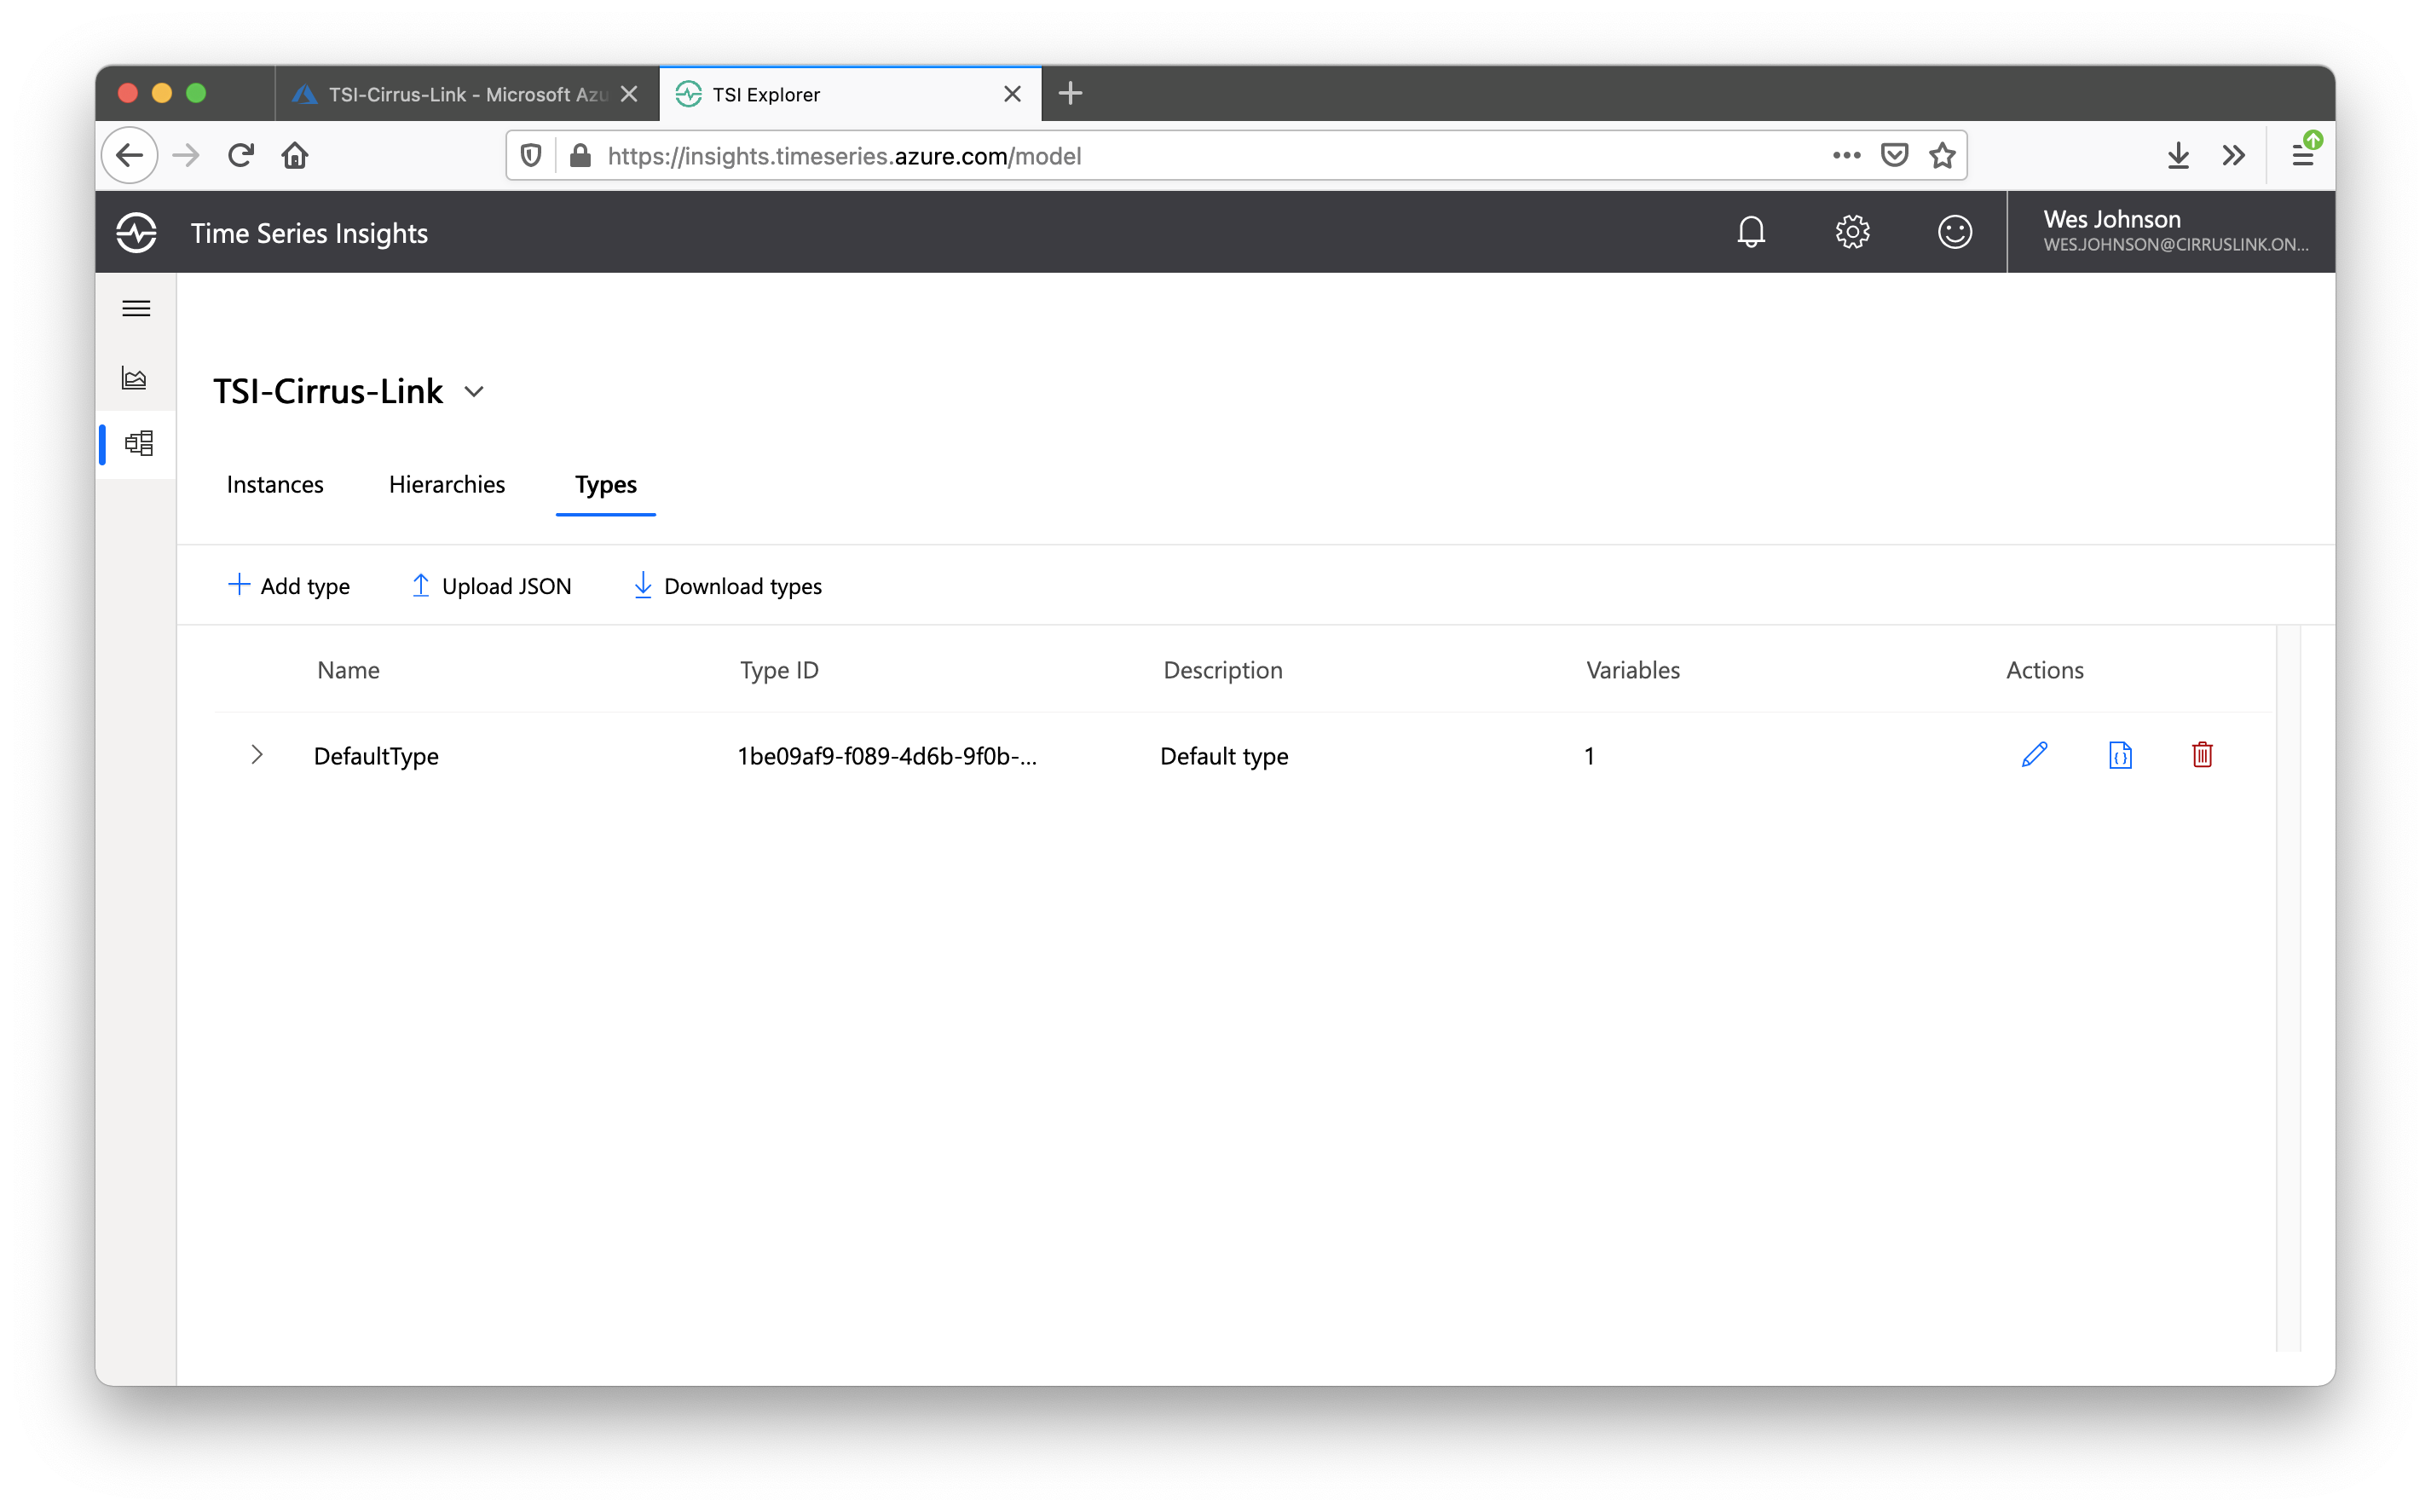
Now click the 'Edit' button to the right of the 'Default type'. This will open a new screen to edit the default type. Then select the 'Variables' tab at the top as shown below.
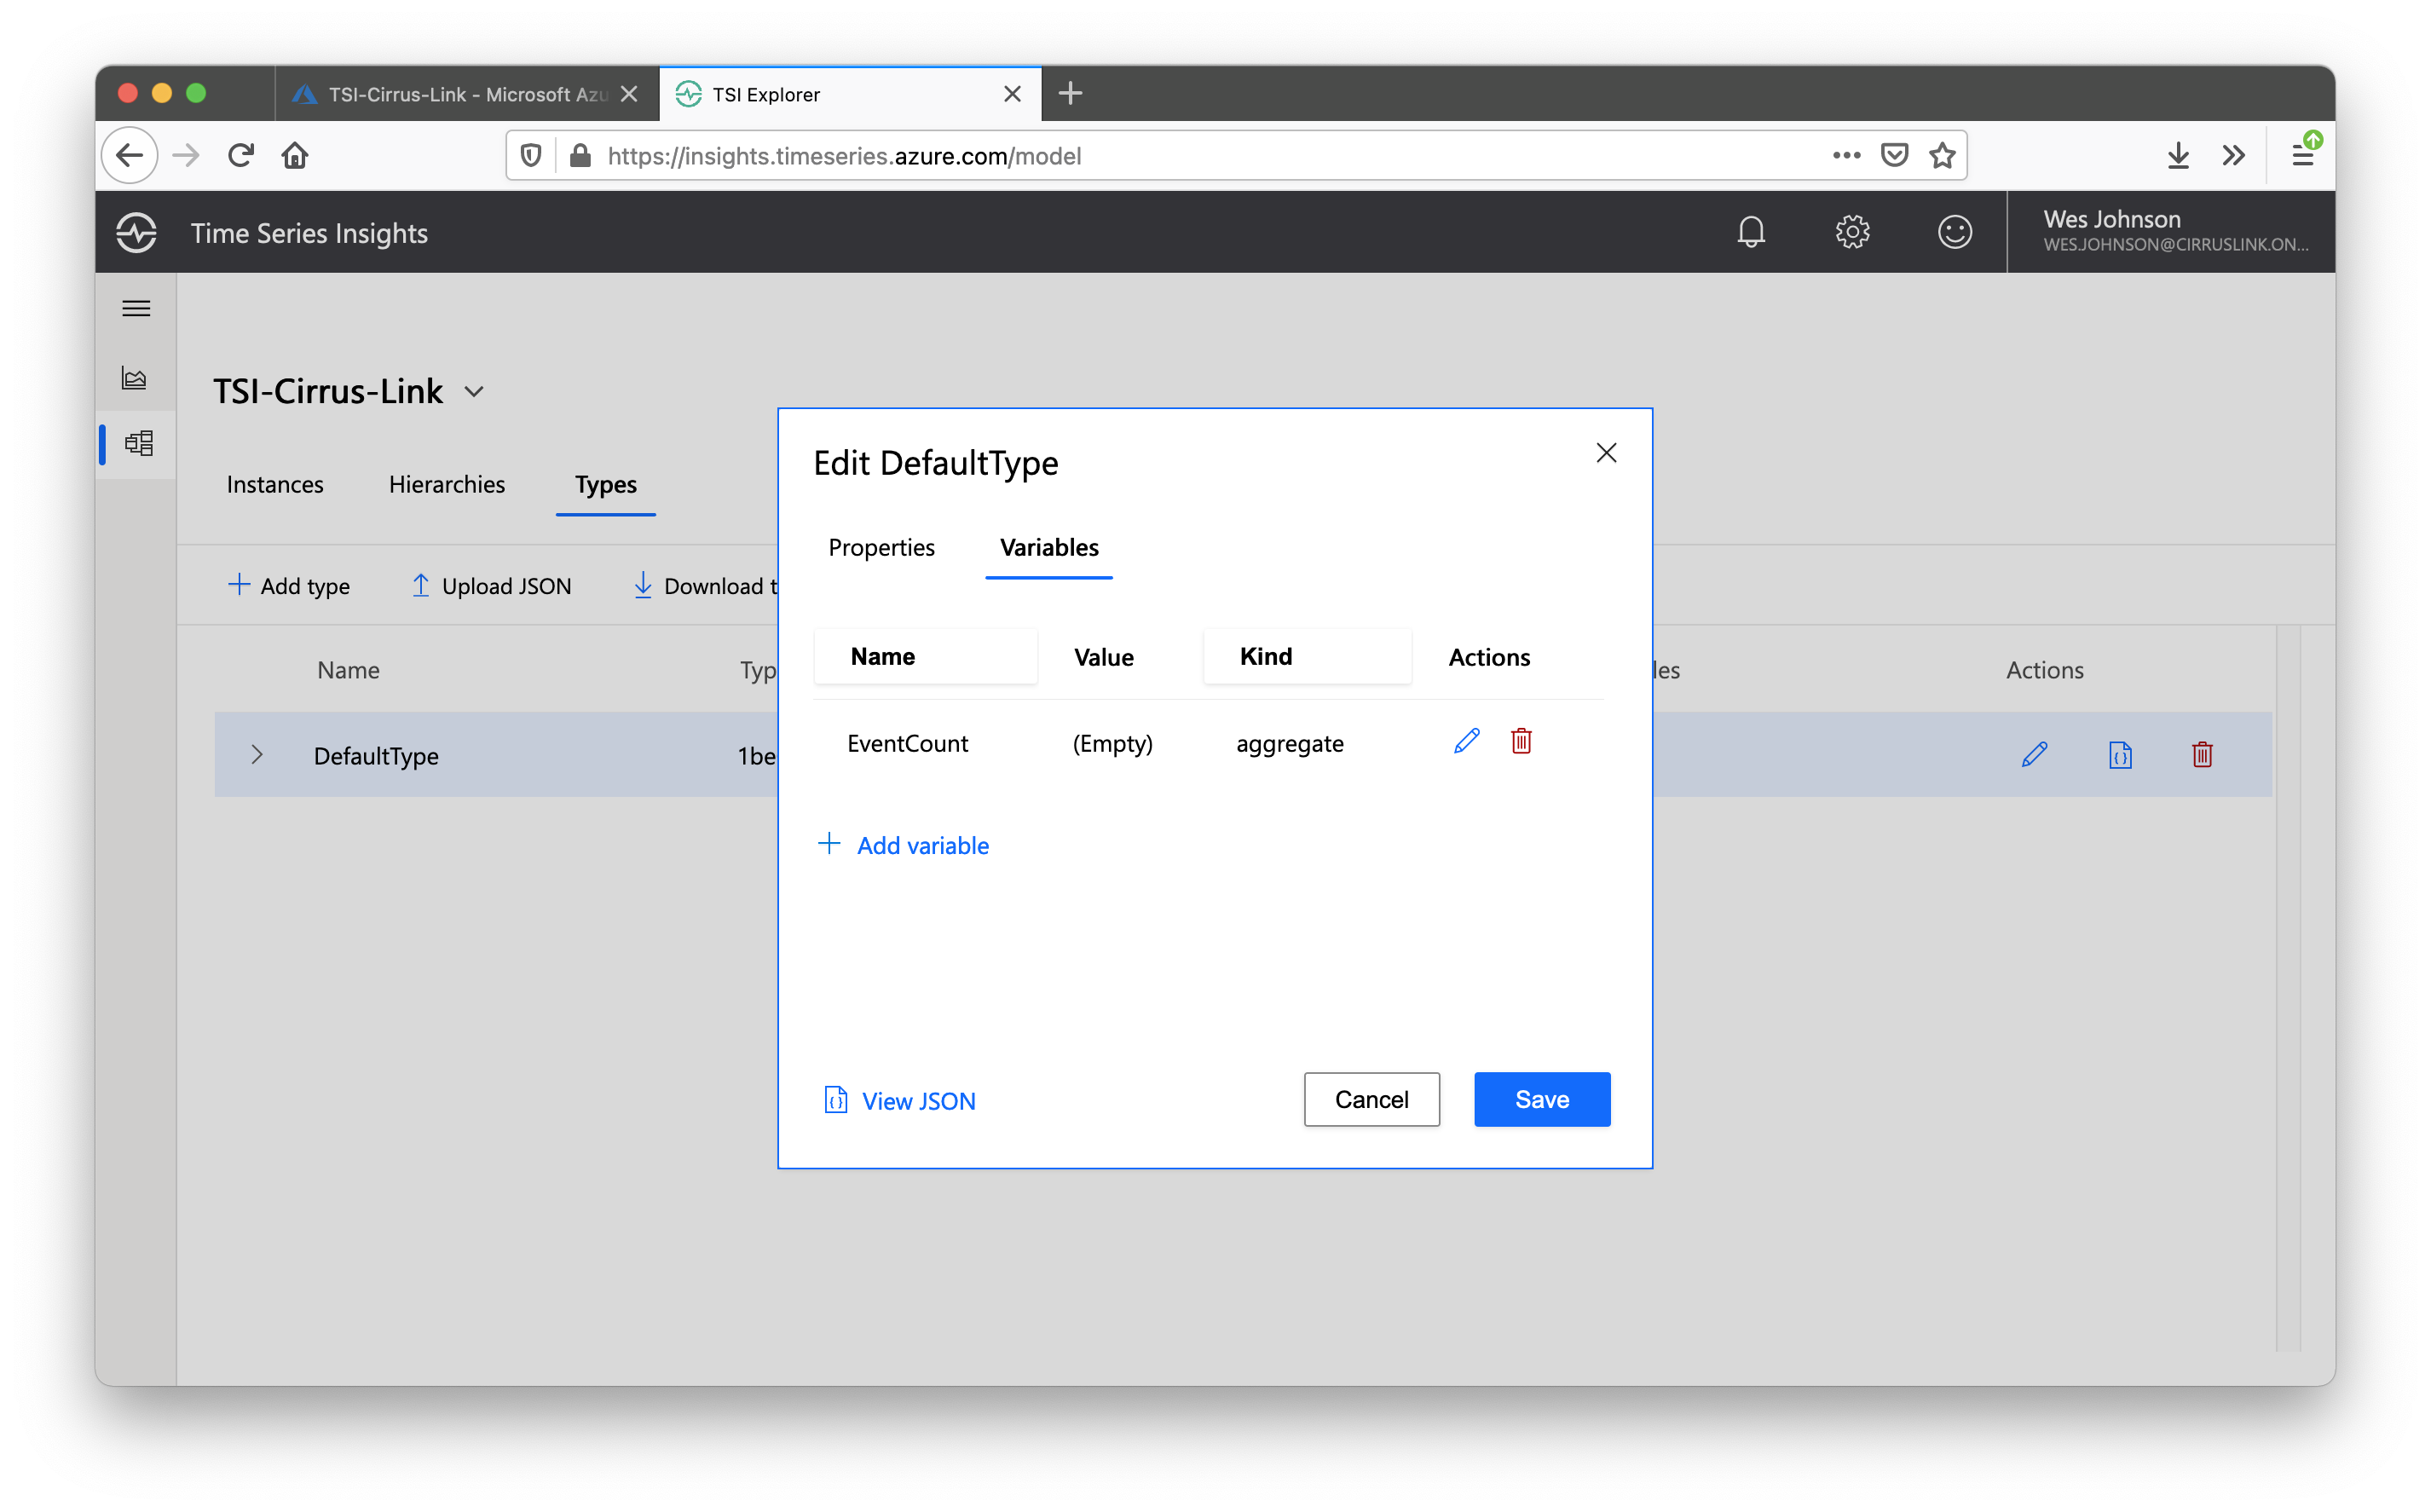
Select the '+ Add variable' button. This will open the following window
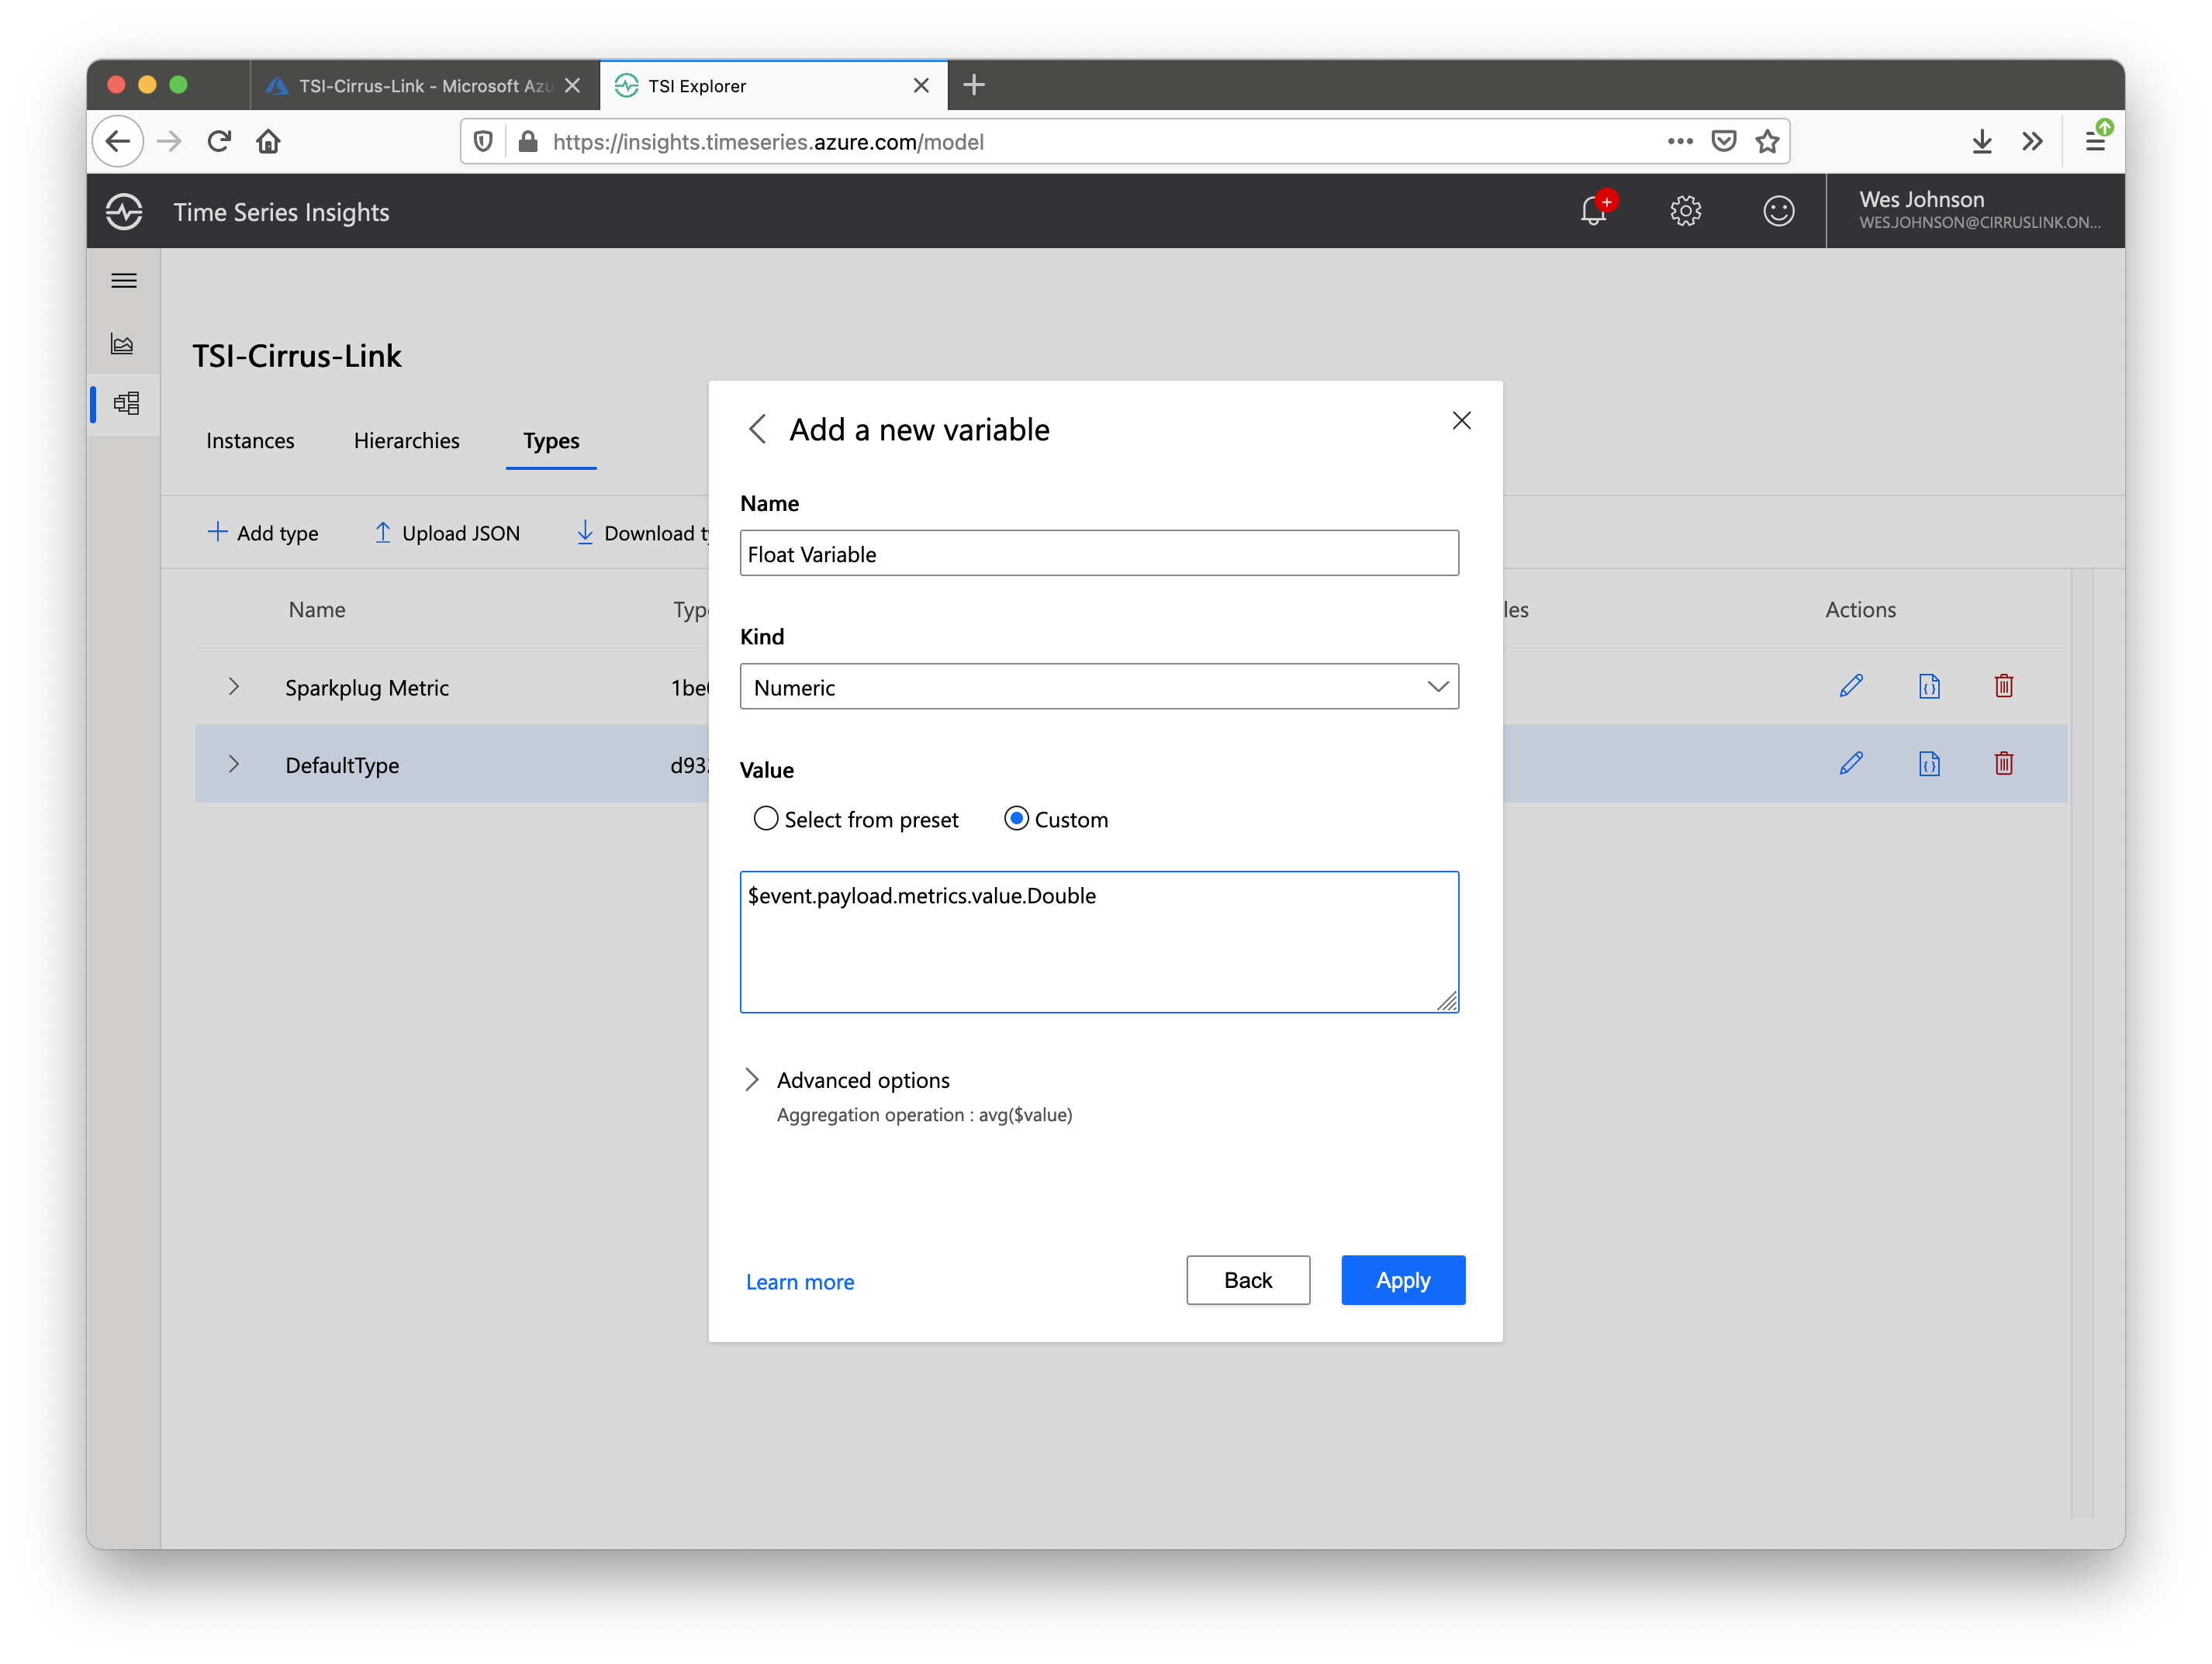
Set the 'Name' to 'Float Value', the Kind' to 'Numeric', and the 'Value' to Custom and '$event.payload.metrics.value.Double' as shown above. When finished click 'Apply' and 'Save'.
At this point, the Time Series Insights Environment is ready to receive data.
Step 3: Pushing Data to Time Series Insights using Azure Injector
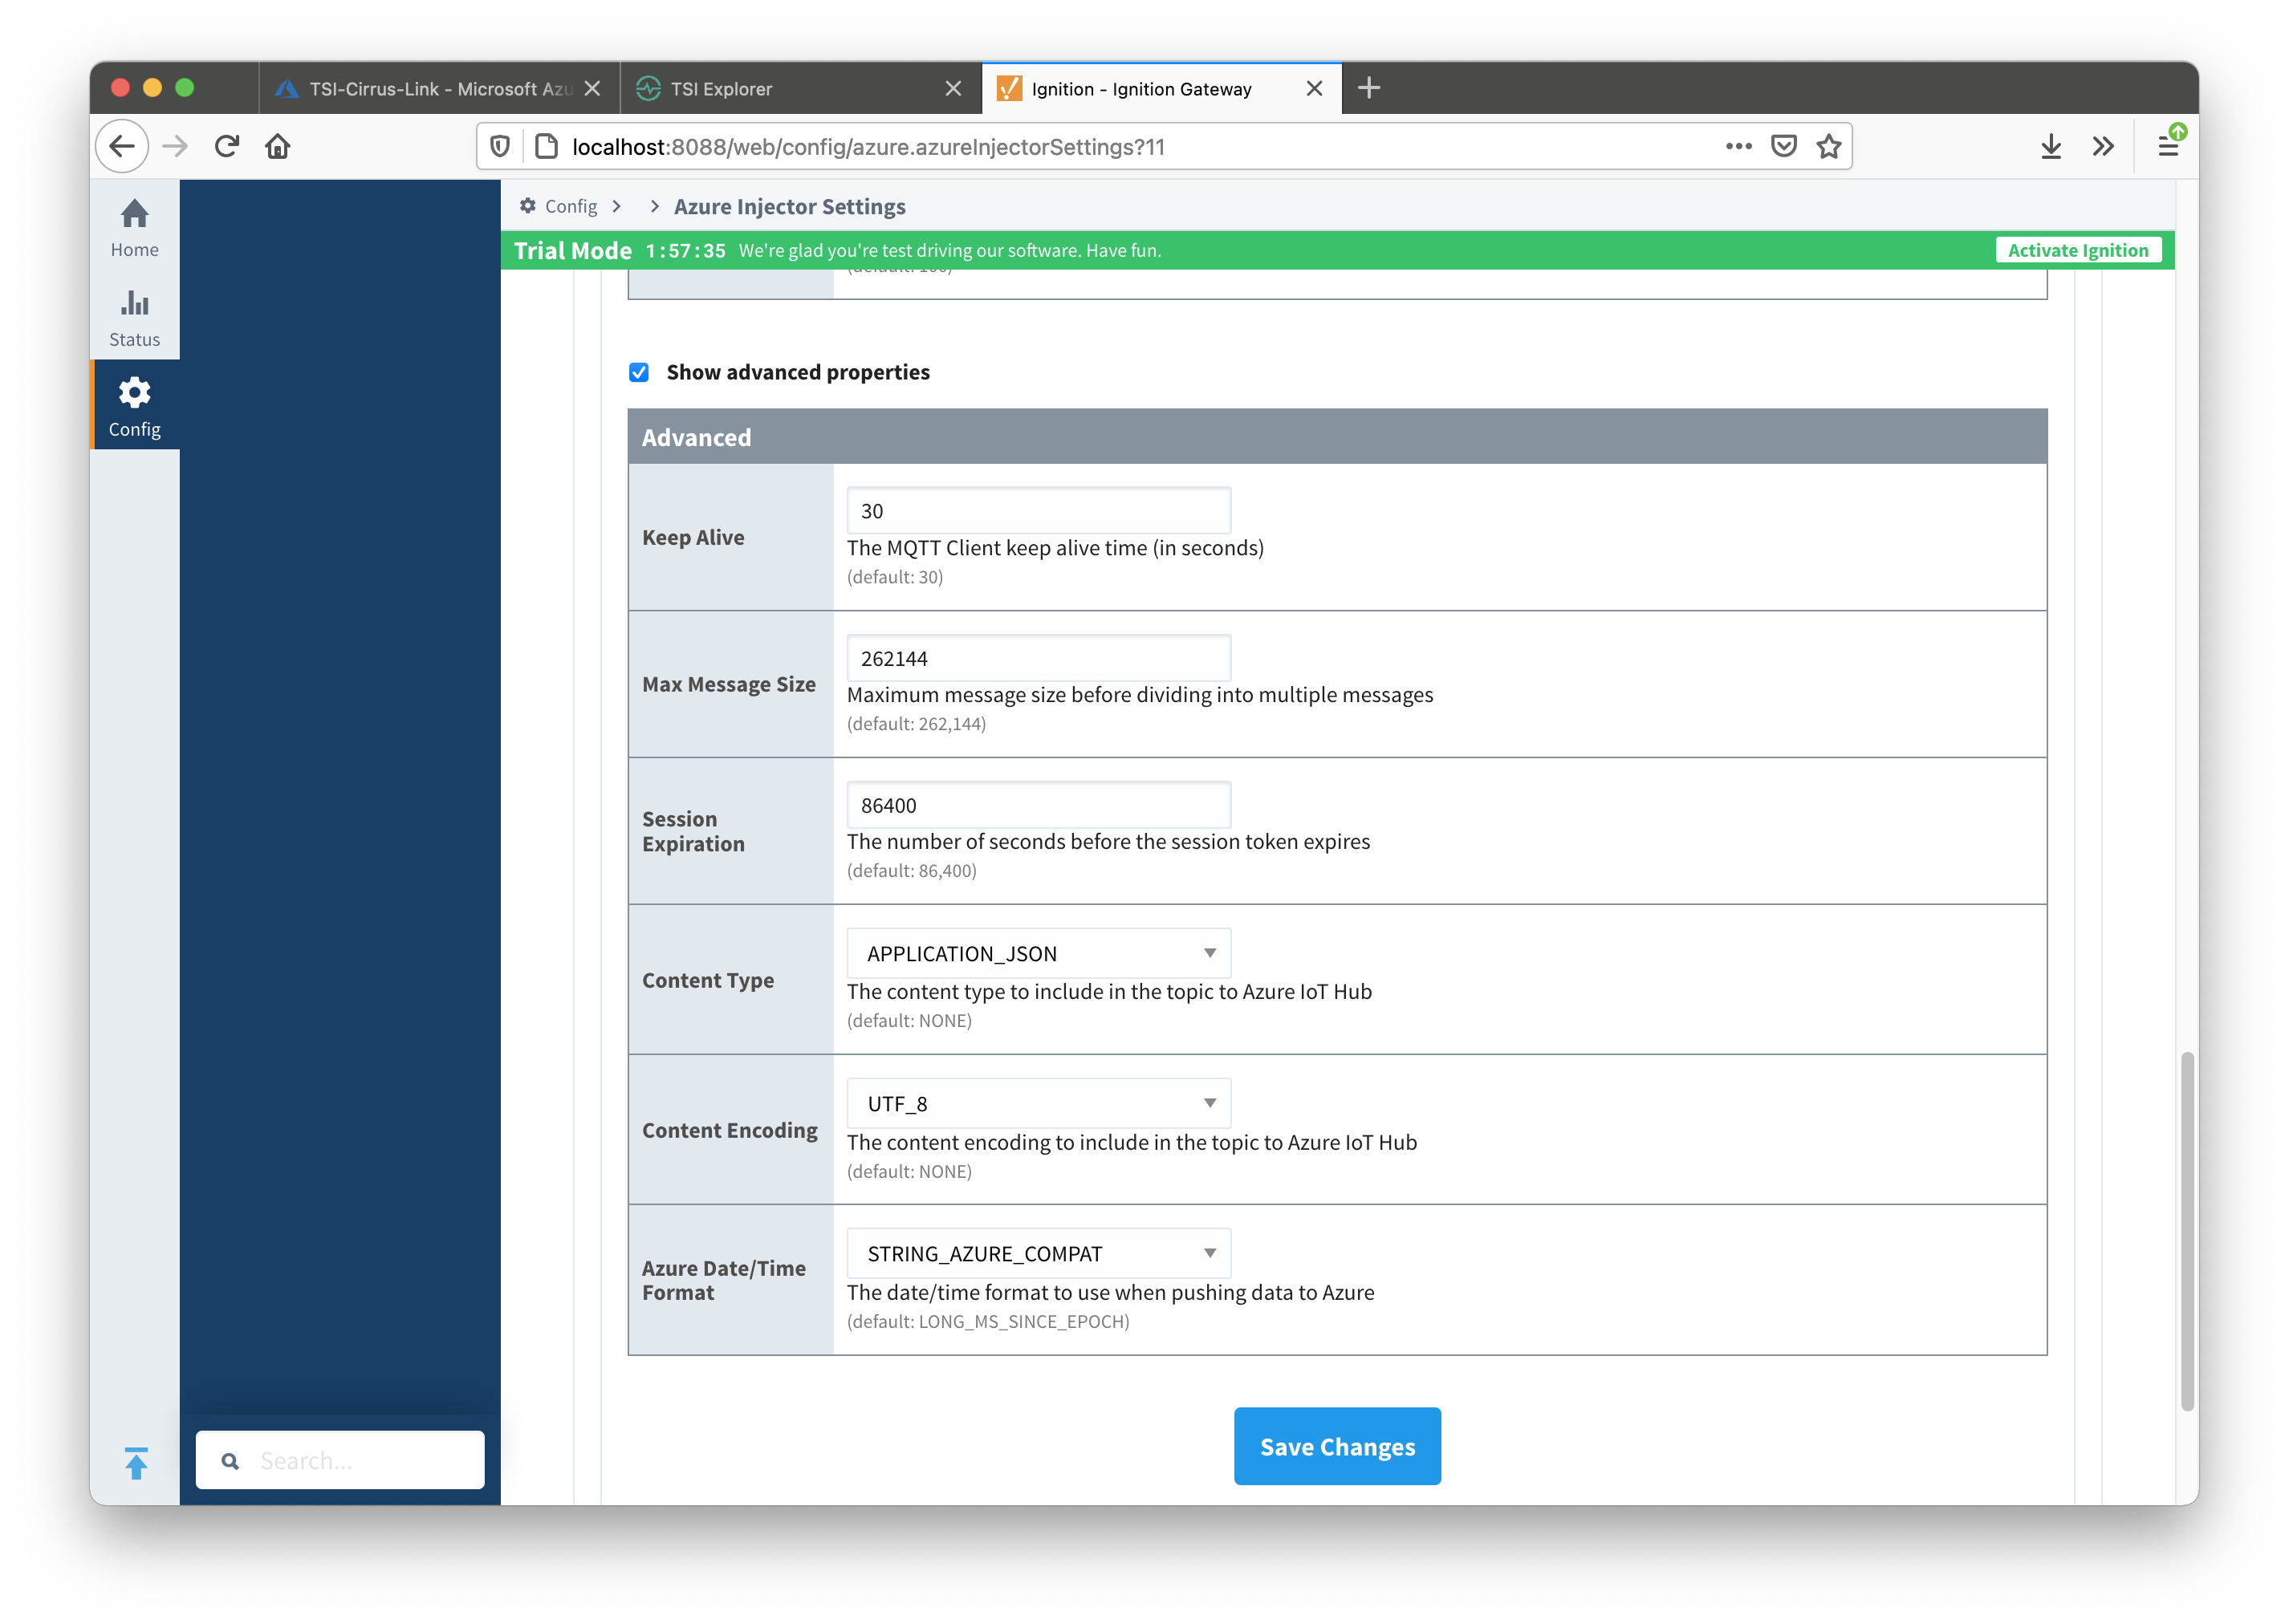
With the work that was done in the prerequisite tutorials there isn't much more to do to get data flowing into Time Series Insights. The first setting to change is in the IoT Hub configuration of Azure Injector. Browse to the Ignition Gateway Web UI and edit the IoT Hub setting as shown below.
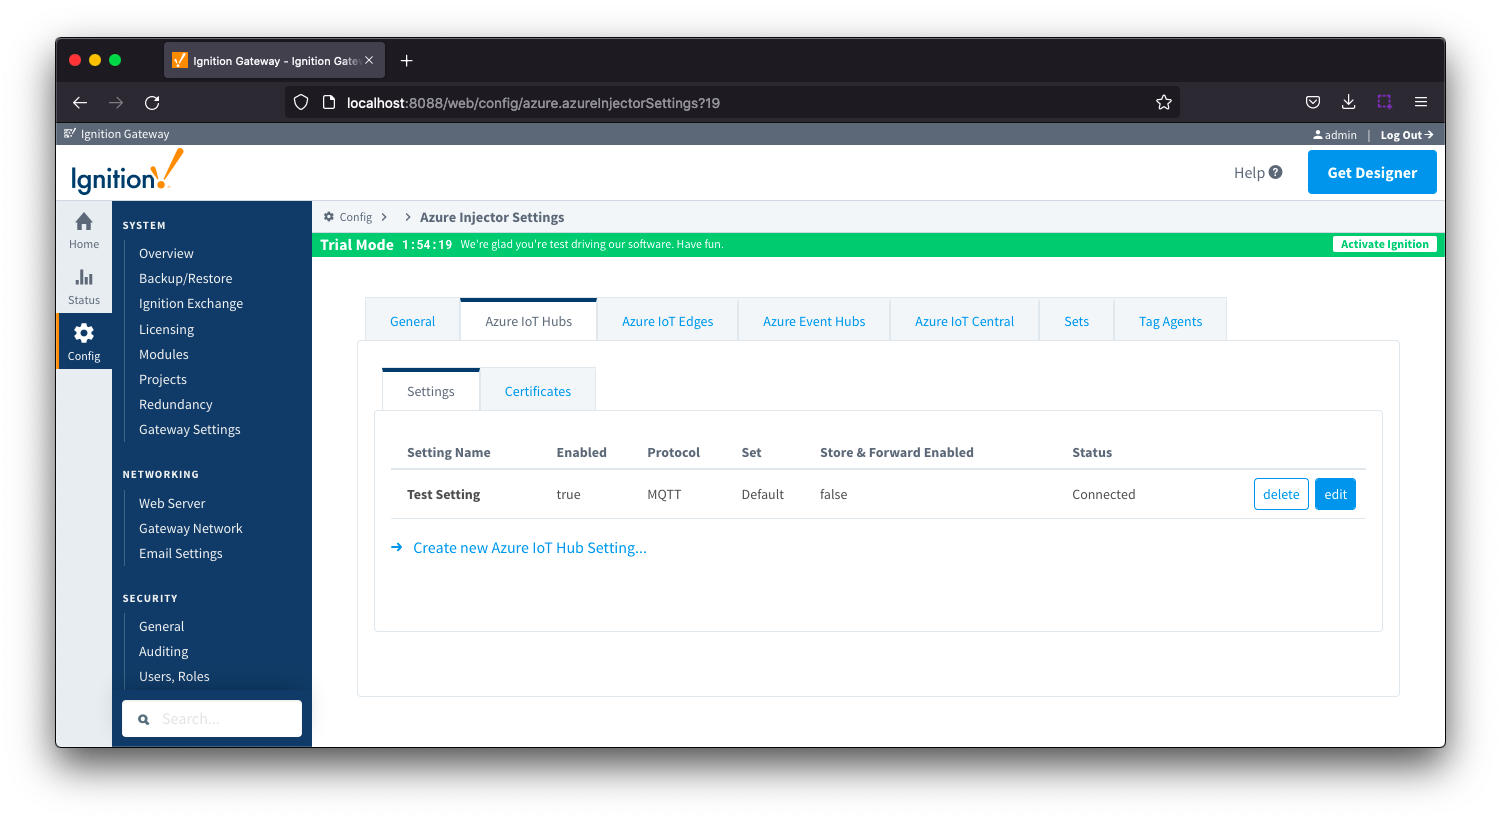
Once on the edit screen, scroll all the way to the bottom of the configuration and select 'STRING_AZURE_COMPAT'. This will ensure that the timestamp that gets used in Time Series Insights will be the 'tag change event time' rather than the time that the data arrives at Time Series Insights.
Now in Ignition Designer, create a Gateway timer script as shown below. This is a simple script that will automatically change the value of the Float001 tag every second. Also, for copy and paste convienence, the code is below as well.
fullTagPath = "[default]Edge Nodes/Tutorial Group/Tutorial Edge Node/Tutorial Device/Float001"
value = system.tag.read(fullTagPath).value
value += 1
if value == 101:
  value = 0

system.tag.write(fullTagPath, value)
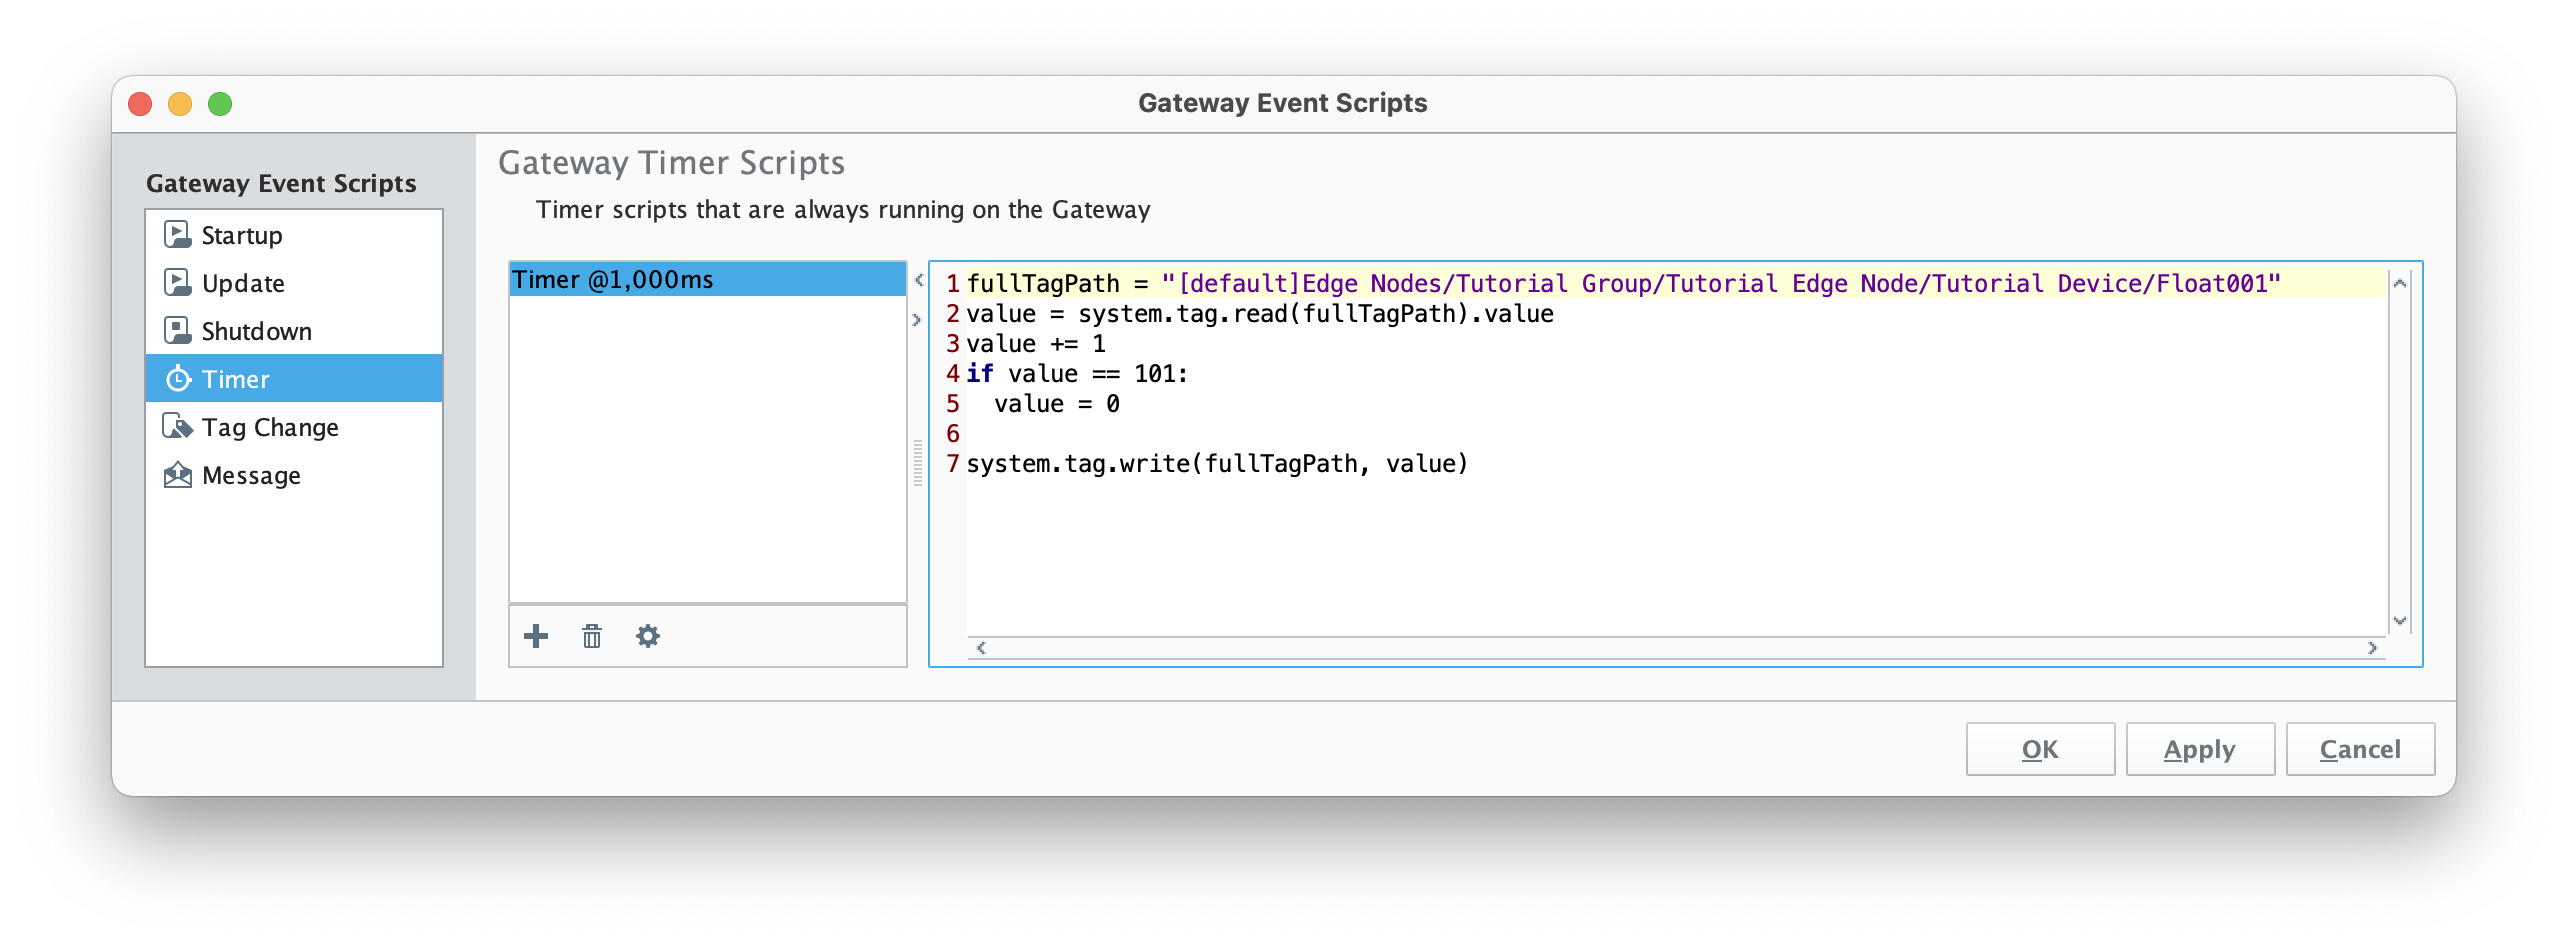
After creating the script, save and publish it. When complete, you should see the '[default]Edge Nodes/Tutorial Group/Tutorial Edge Node/Tutorial Device/Float001' tag incrementing every second.
At this point, data should be flowing from Azure Injector, to IoT Hub, to your new Time Series Insights Environment.
Step 4: Viewing Data in Time Series Insights
In the Time Series Insights Dashboard, select the 'Analyze' option from the upper left navigation menu as shown below.
After selecting the Analyze screen, you should see something similar to what is shown below. Because data should now be being routed to your Time Series Insights Environment you should also have time series instances in your environment similar to those shown below.
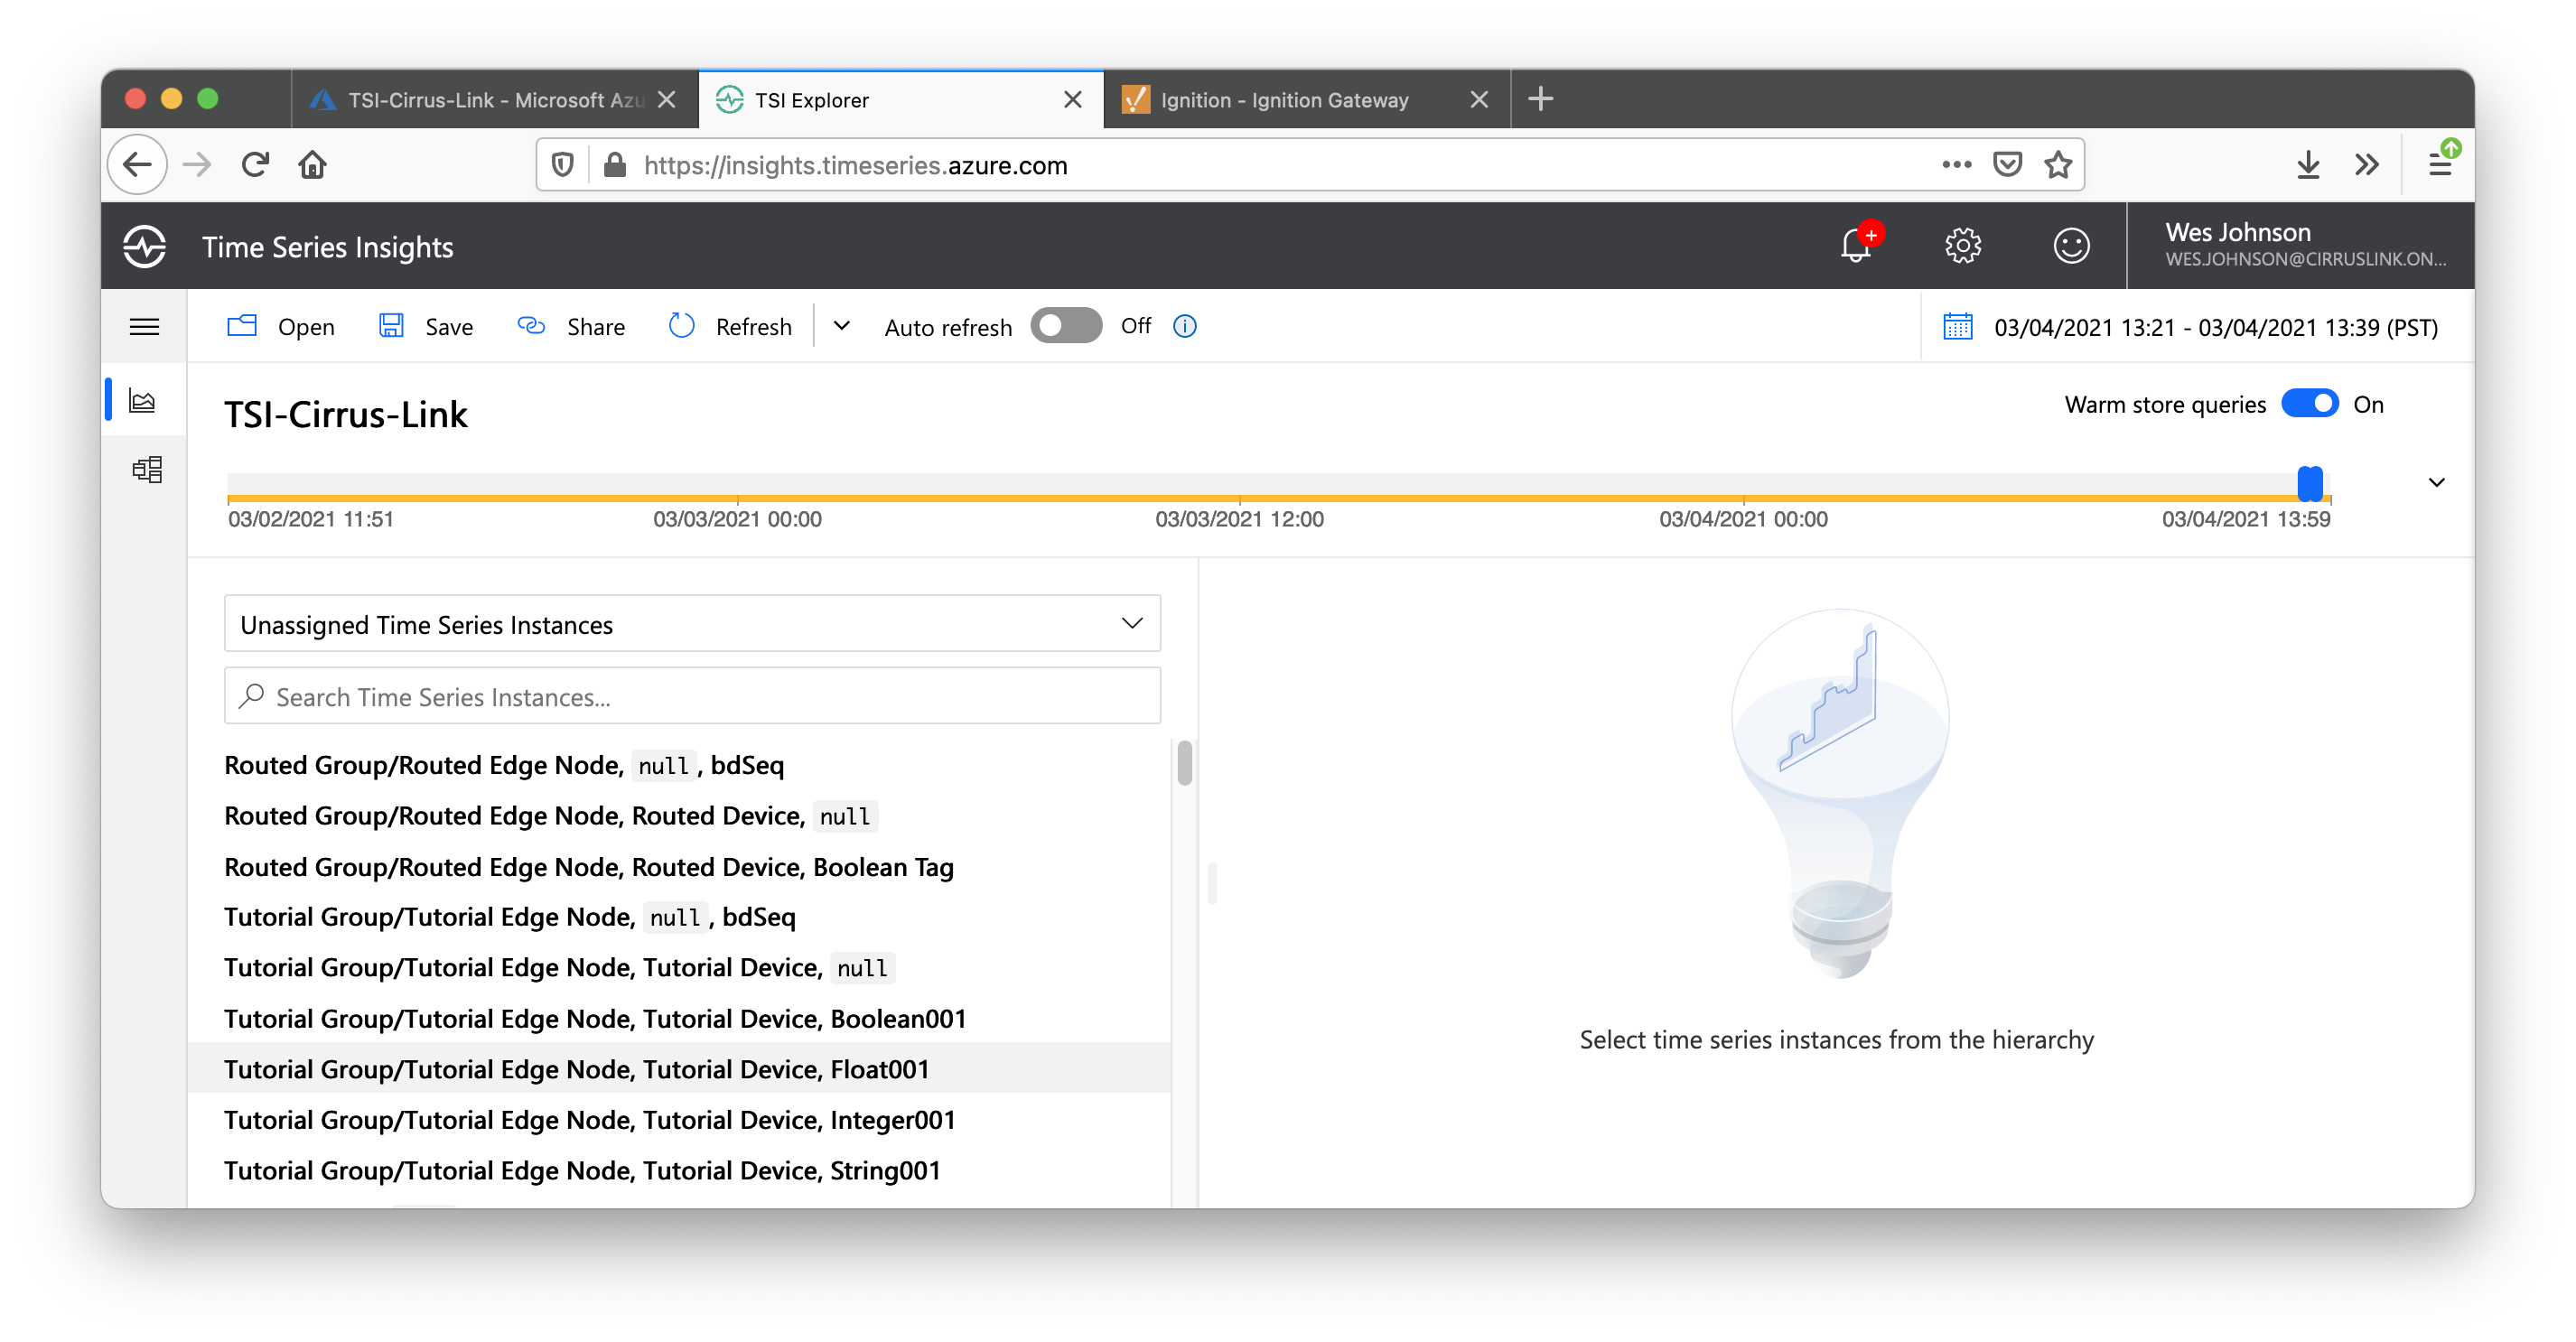
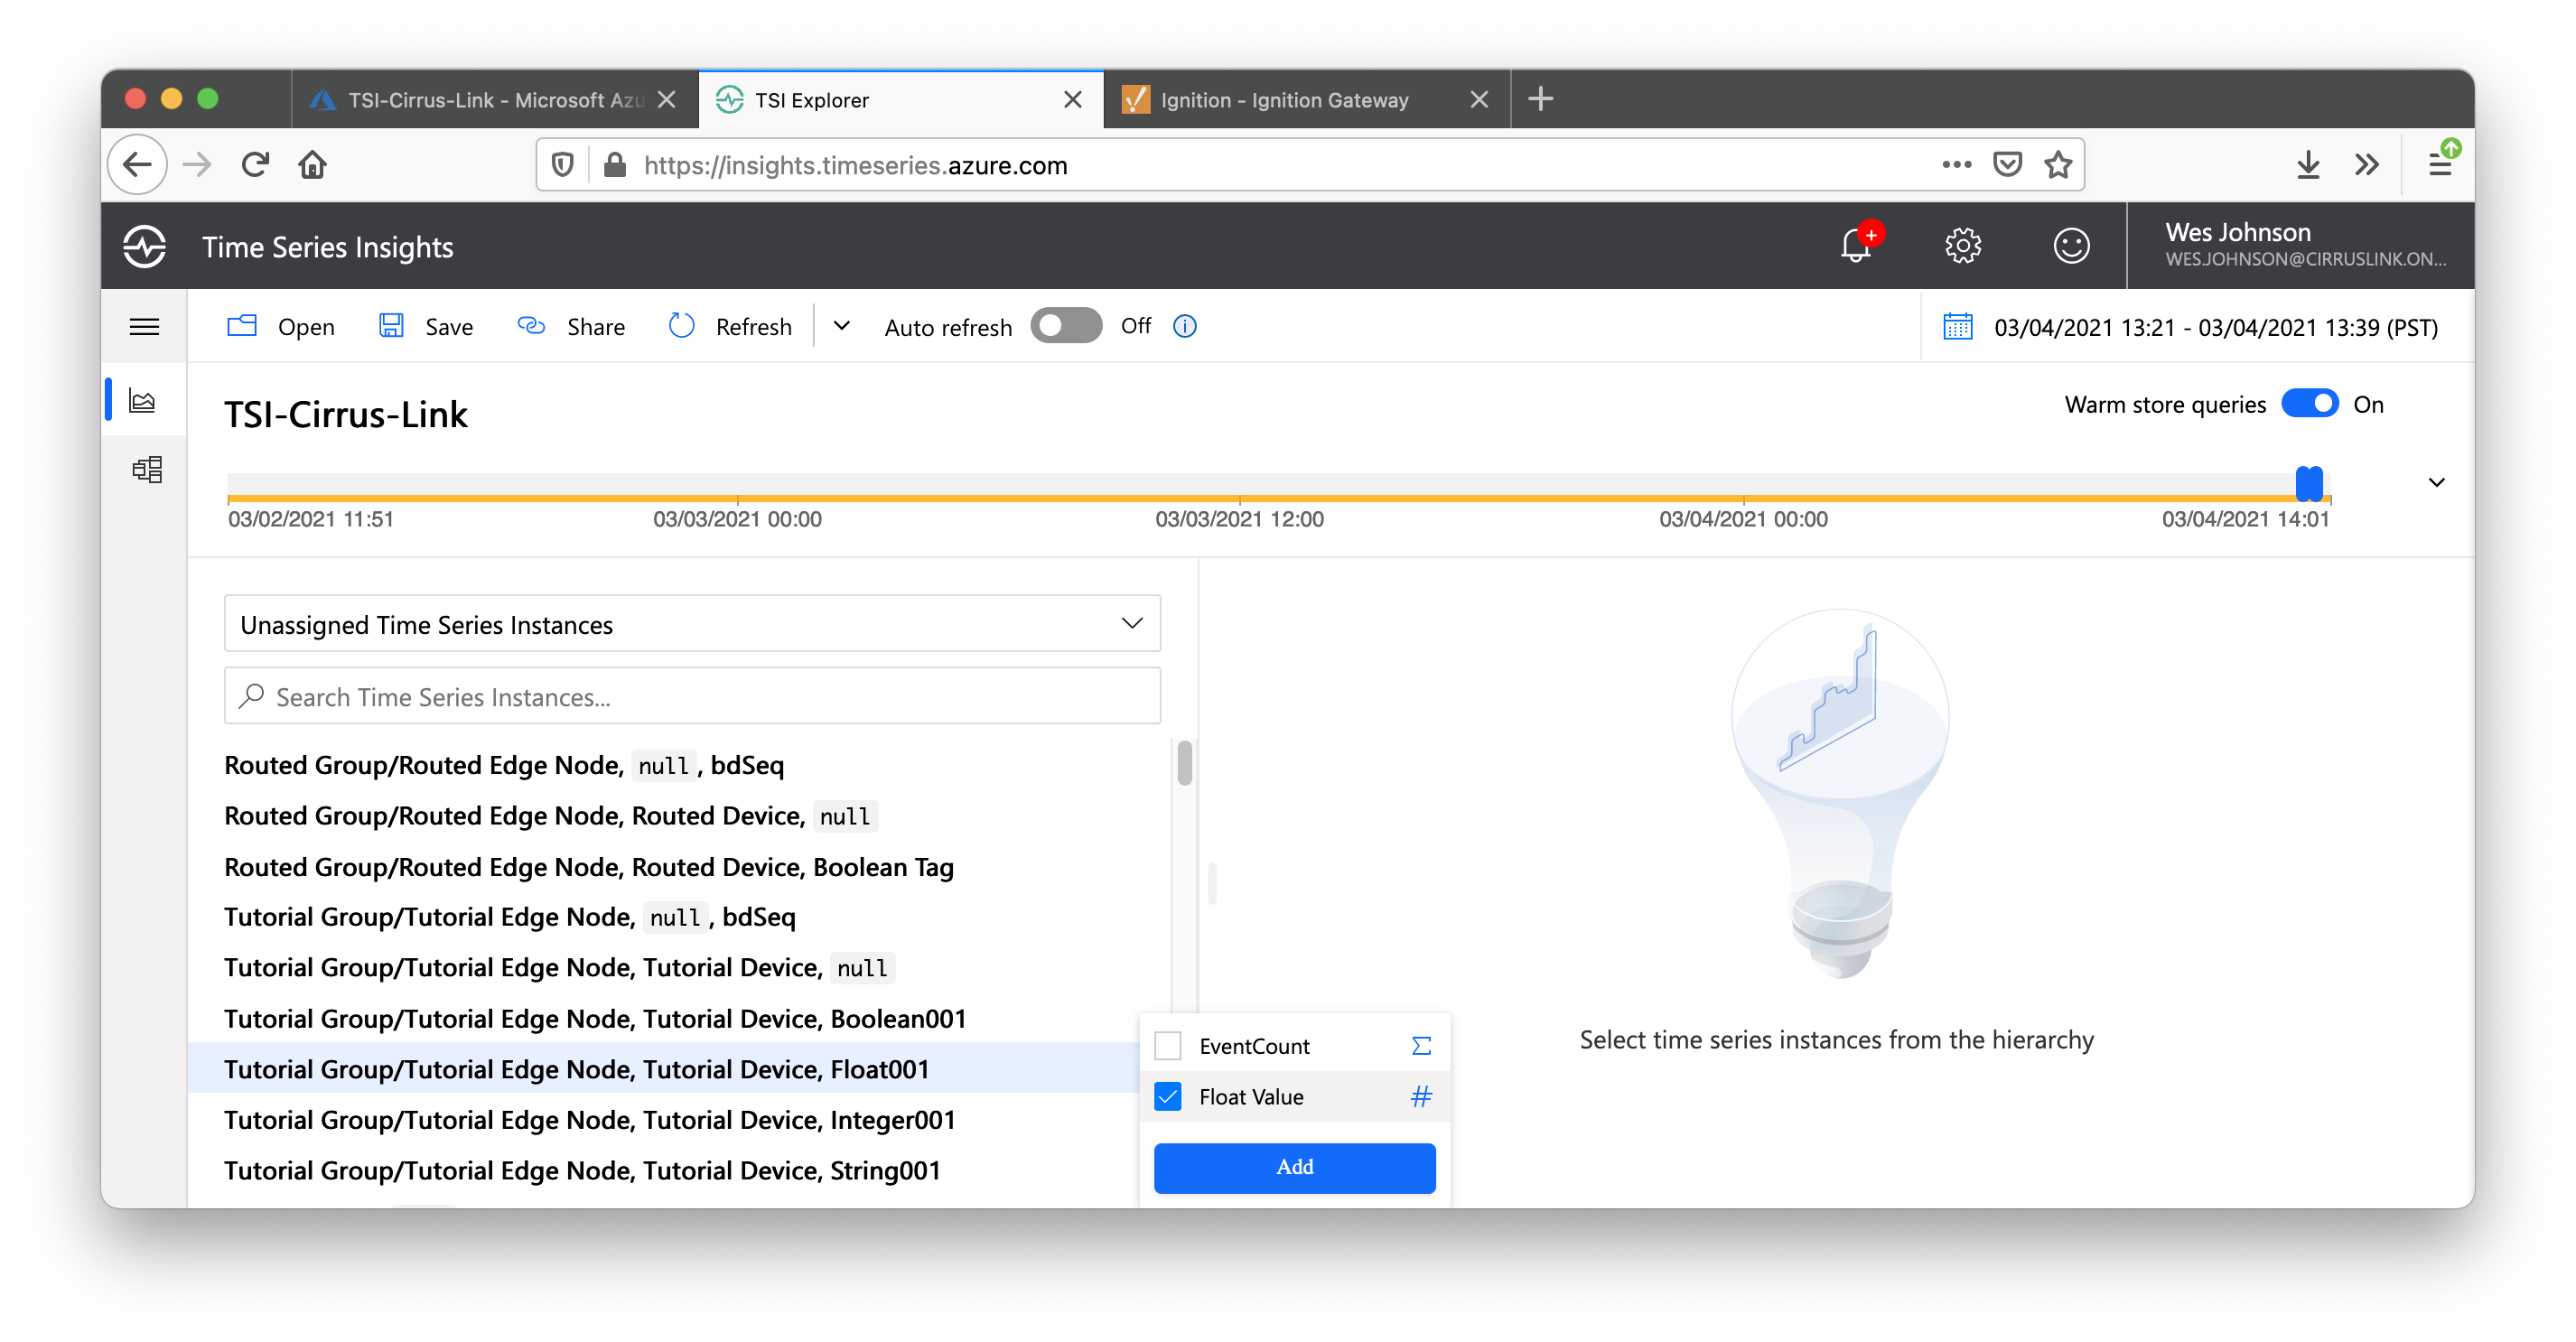
Click on Tutorial Group 'Float001' tag as shown below. This will open a dialog box. Select 'Float Value' and click 'Add' also shown below.
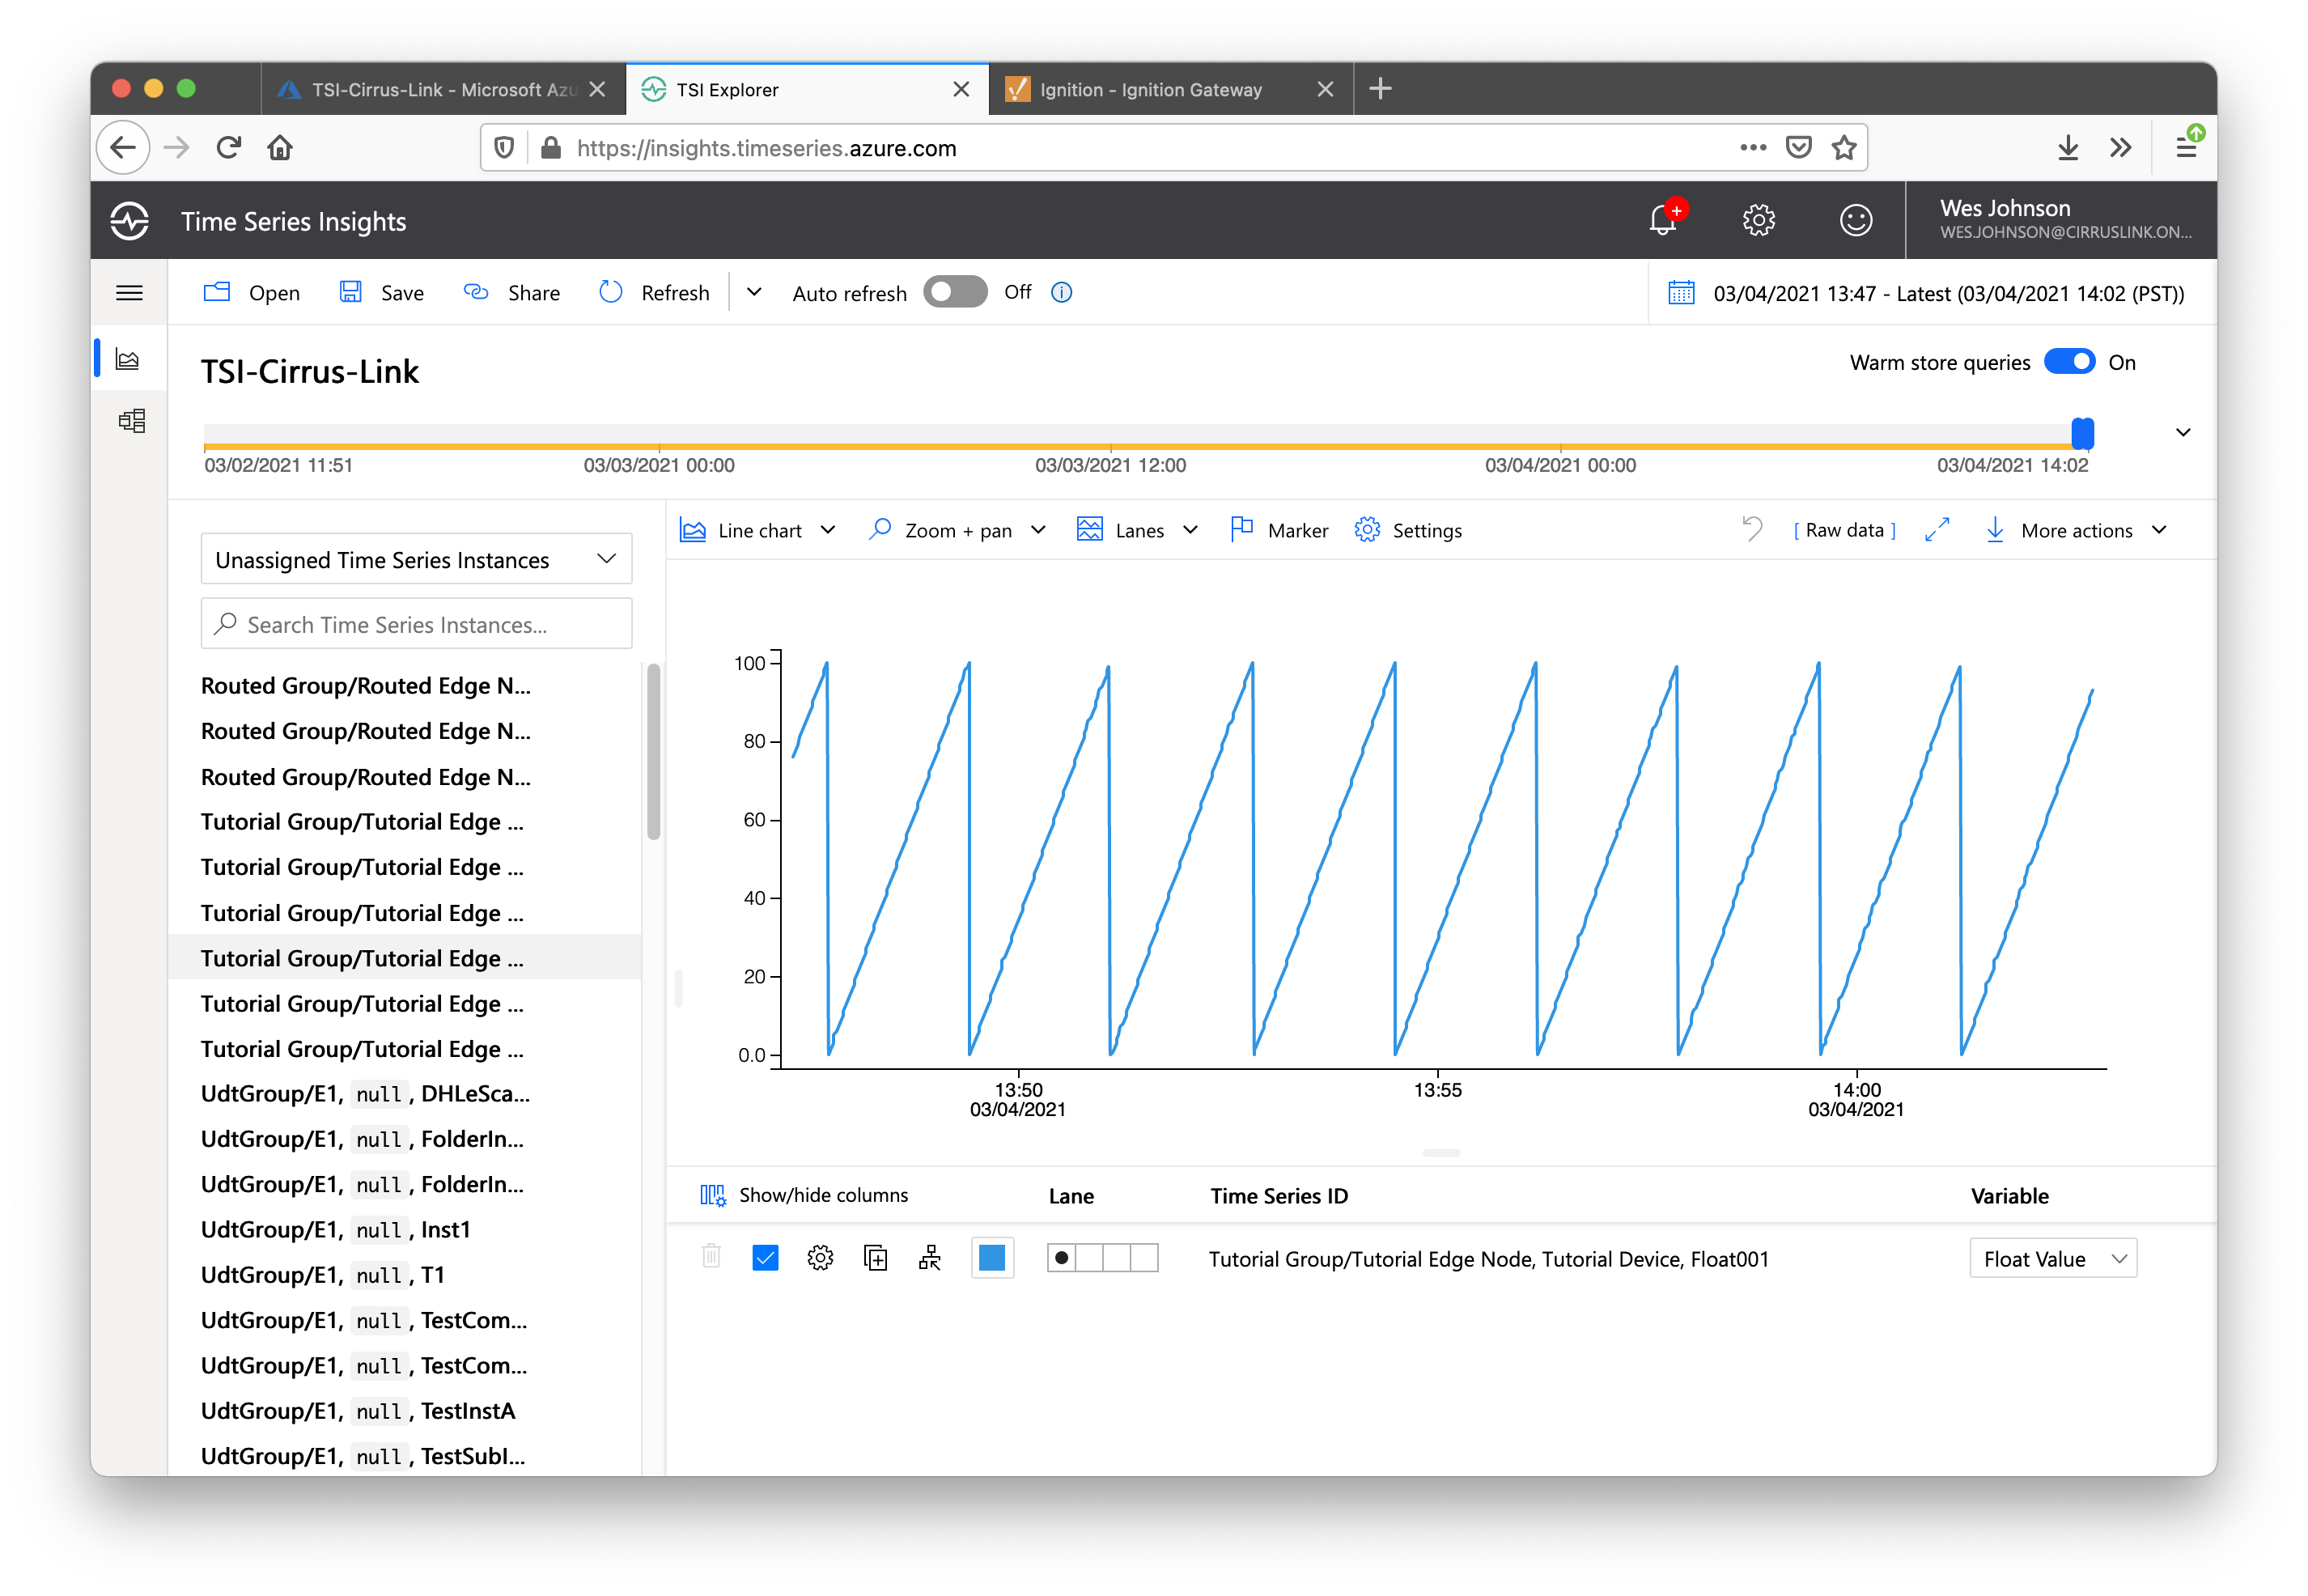
After doing so, you should see your time series data in the chart as shown below.
Additional Resources
- Additional Azure Injector Tutorials
- Azure Time Series Insights Ingestion Overview
- Azure Time Series Insights Model Overview
- Inductive Automation's Ignition download with free trial
- Azure Injector download with free trial
- Questions about this tutorial?
- Sales questions
- About Cirrus Link