![]()
Contents
Cirrus Link Resources
Cirrus Link Website![]()
Contact Us (Sales/Support)![]()
Forum![]()
Cirrus Link Modules Docs for Ignition 7.9.x![]()
Inductive Resources
Ignition User Manual![]()
Knowledge Base Articles![]()
Inductive University![]()
Forum![]()
![]()
Cirrus Link Website![]()
Contact Us (Sales/Support)![]()
Forum![]()
Cirrus Link Modules Docs for Ignition 7.9.x![]()
Ignition User Manual![]()
Knowledge Base Articles![]()
Inductive University![]()
Forum![]()
...
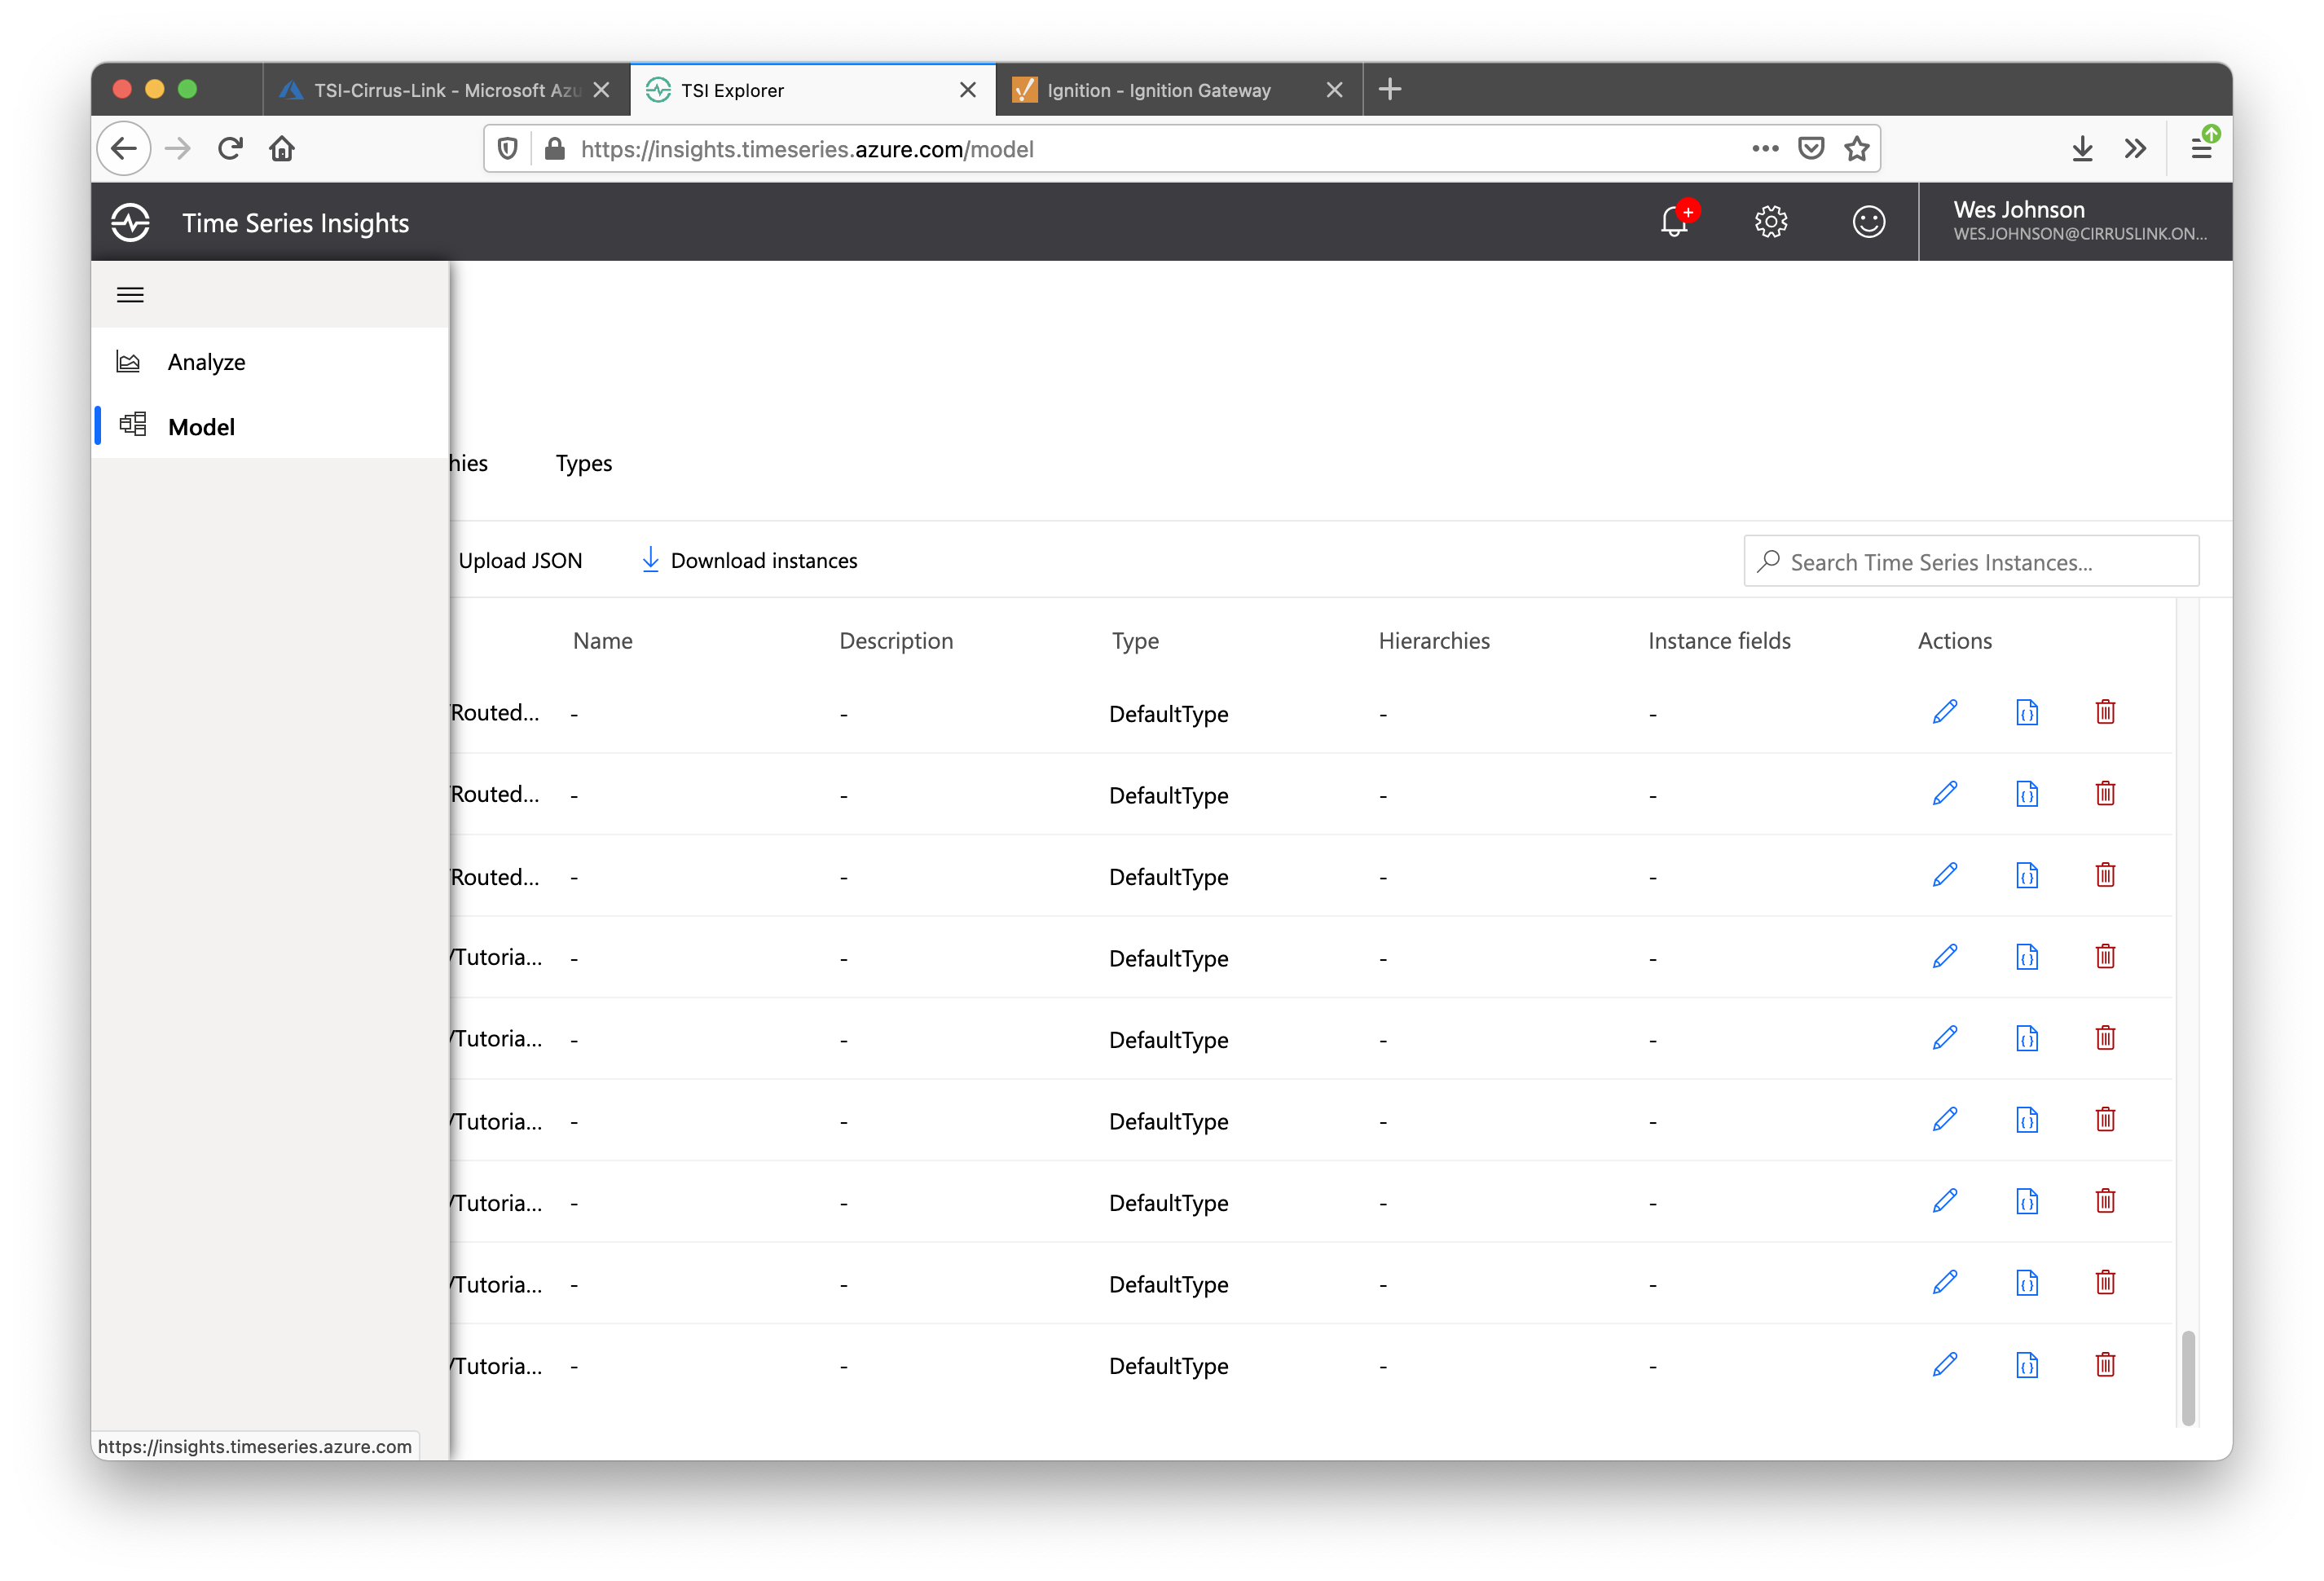
In the Time Series Insights Dashboard, select the 'Analyze' option from the upper left navigation menu as shown below.
After selecting the Analyze screen, you should see something similar to what is shown below. Because data should now be being routed to your Time Series Insights Environment you should also have time series instances in your environment similar to those shown below.
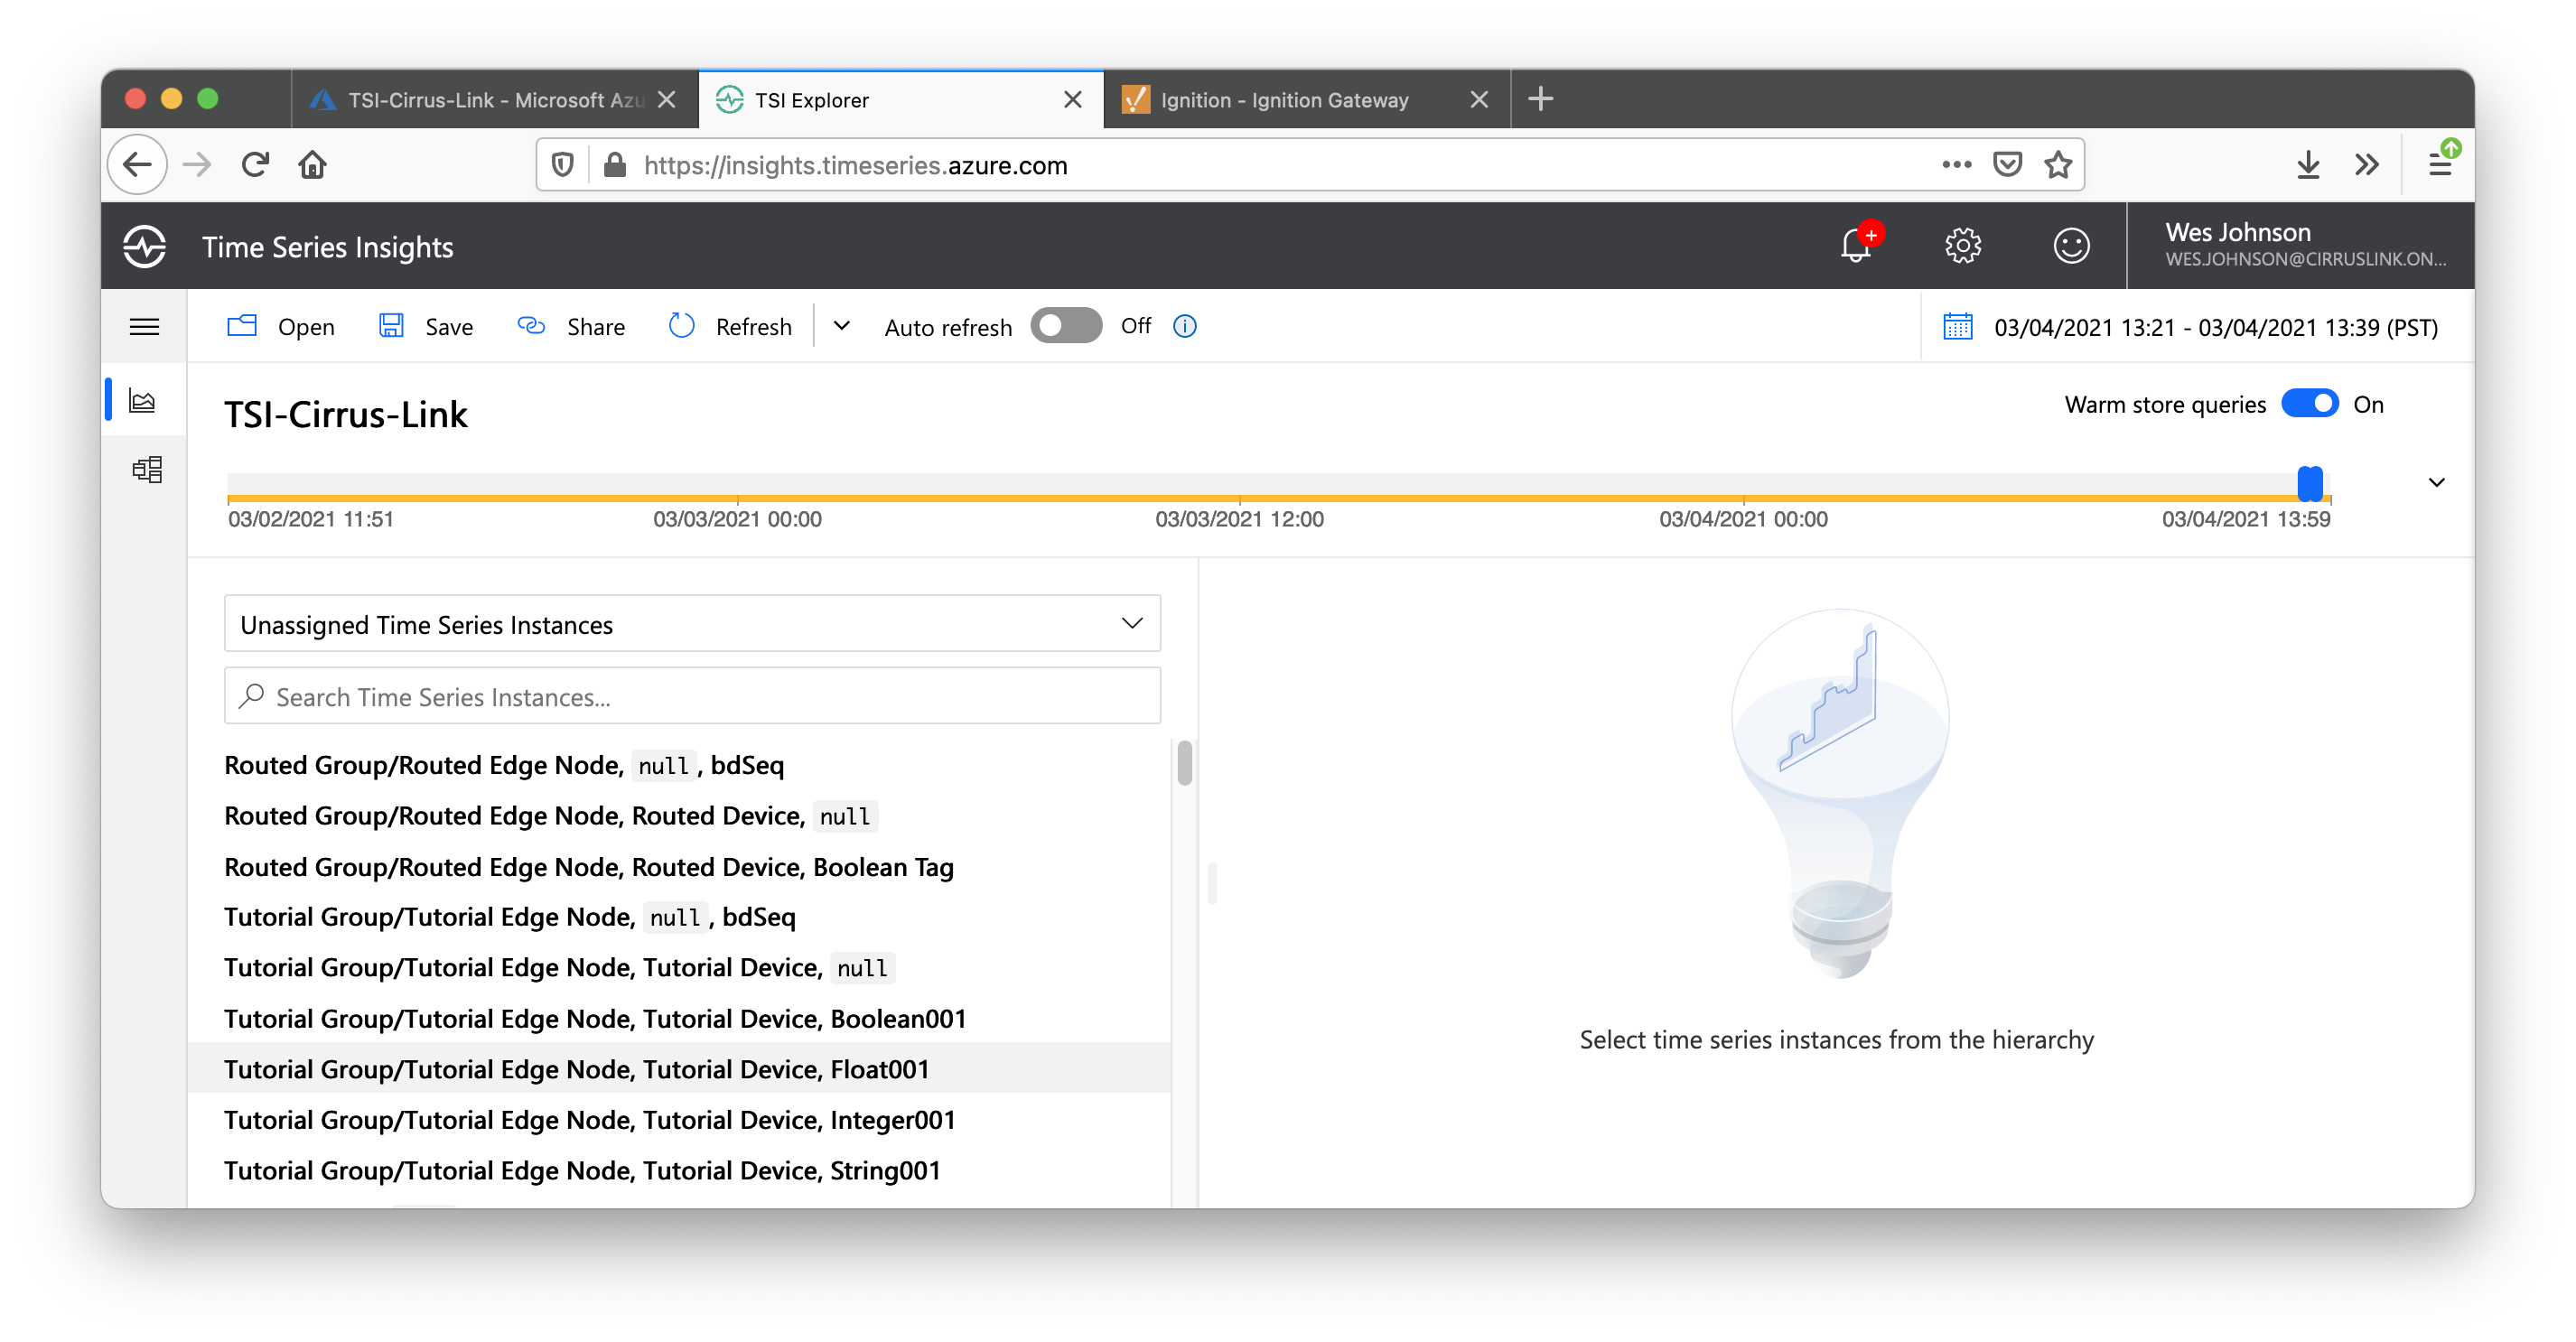
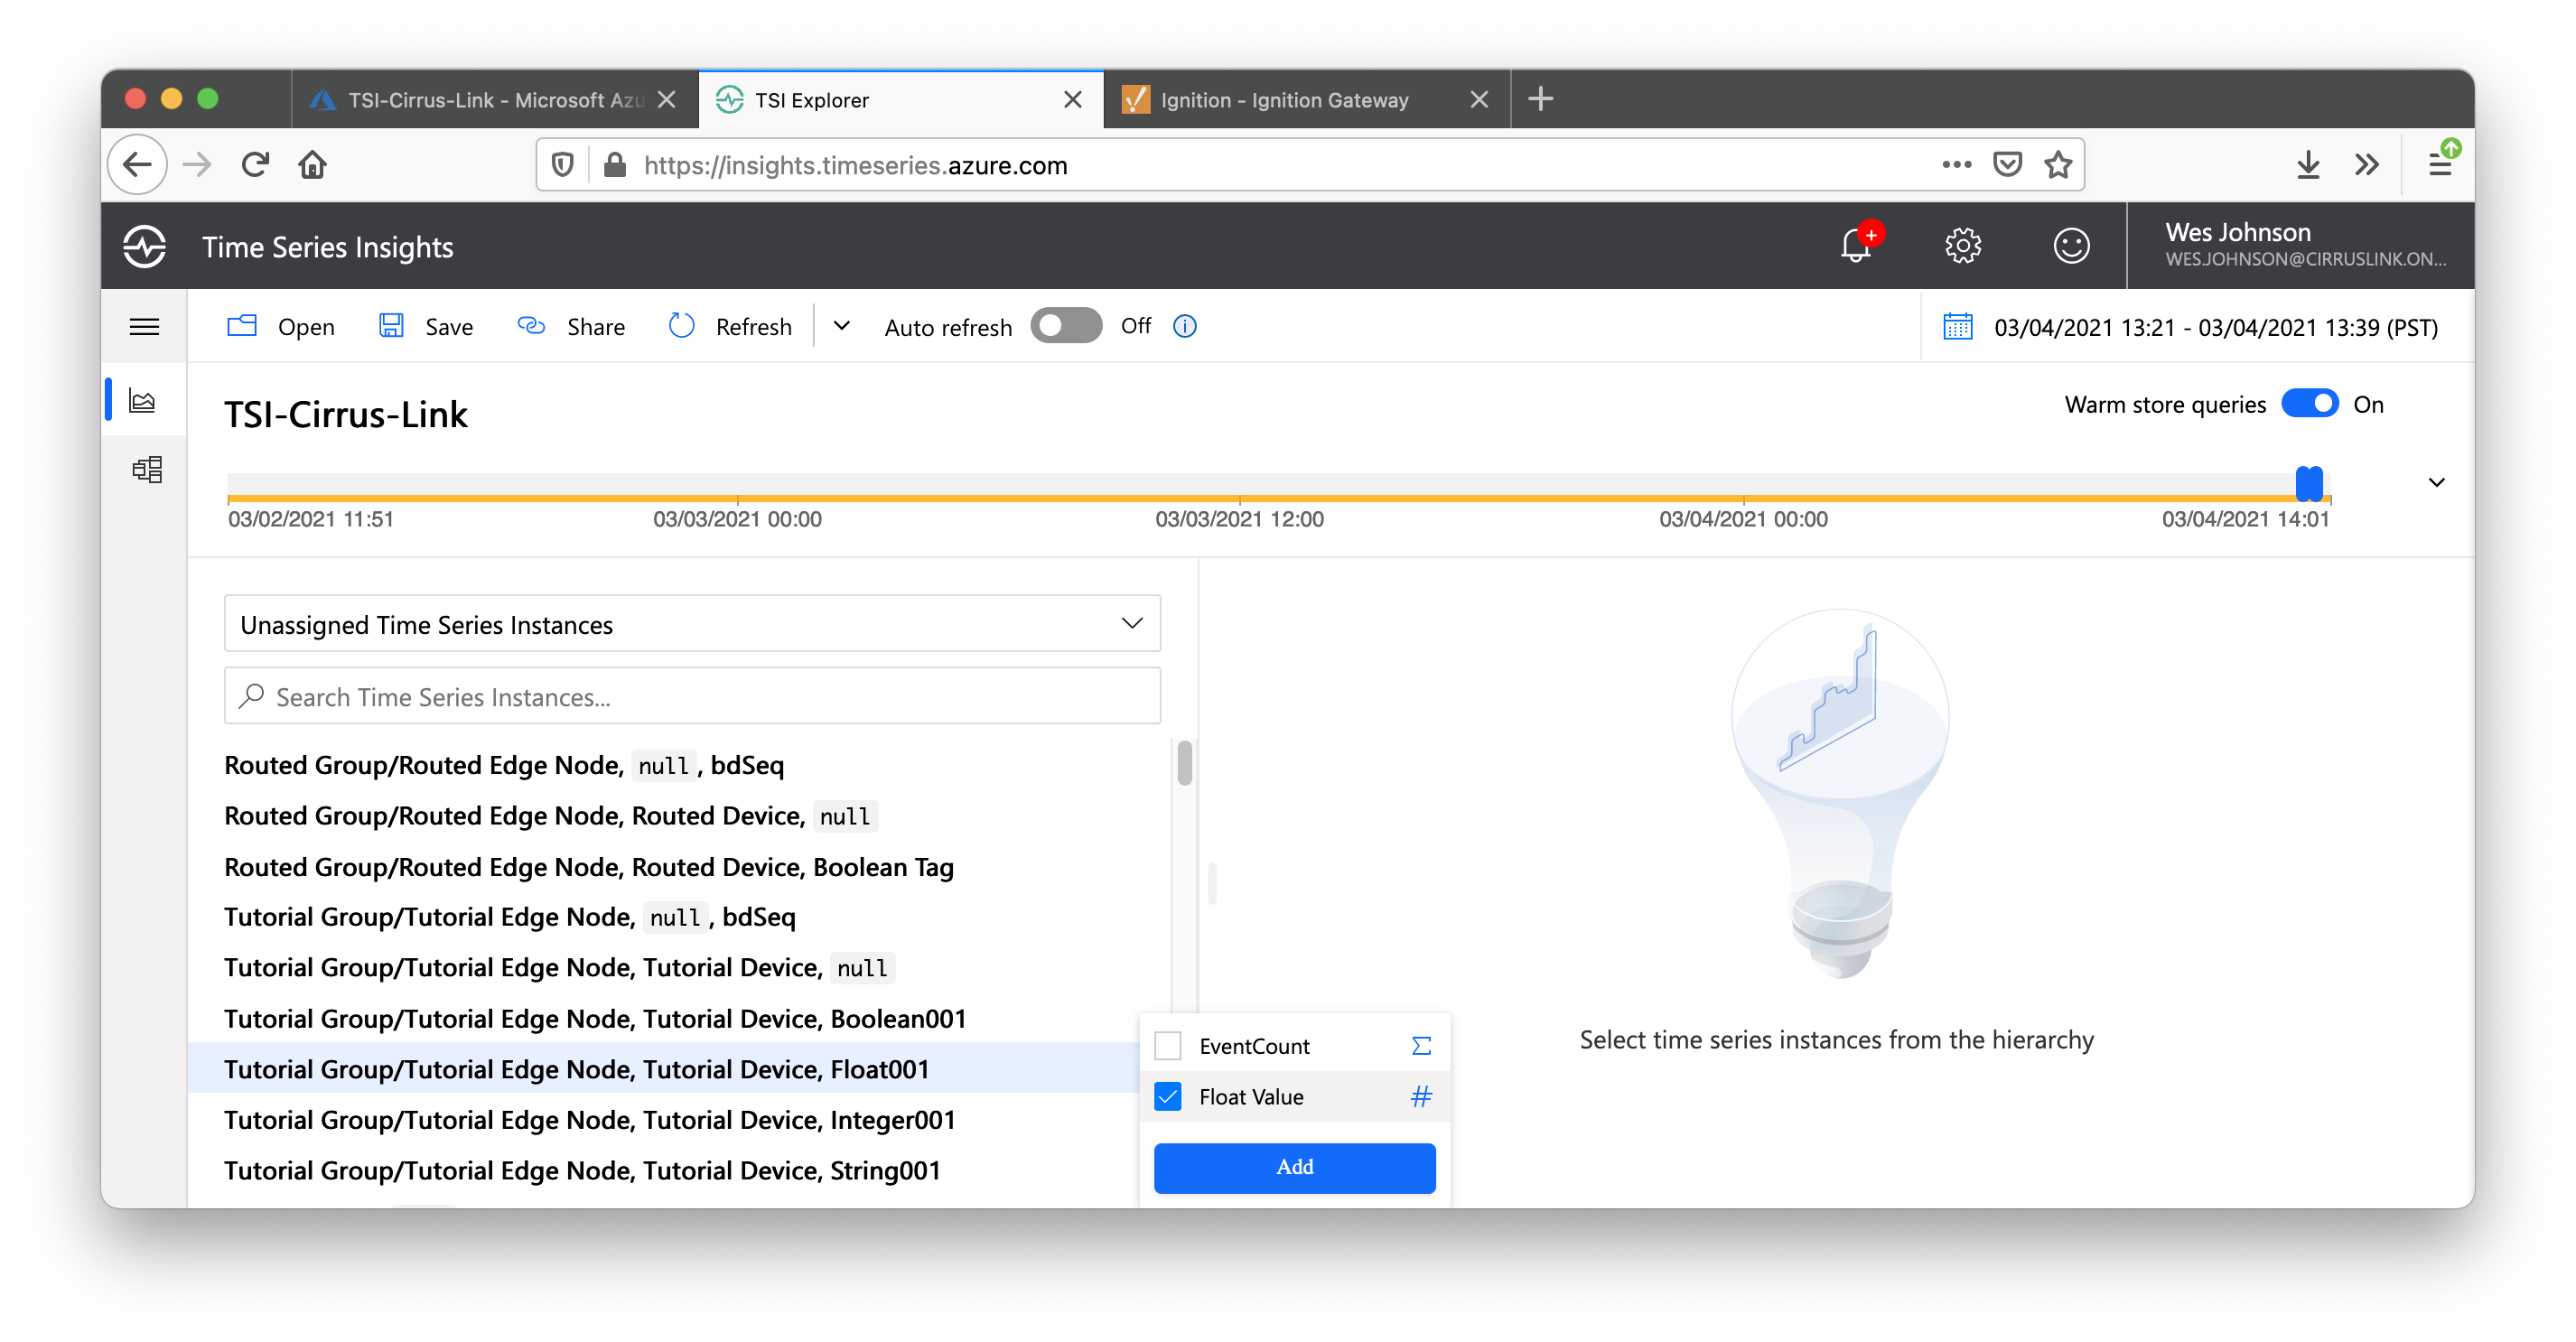
Click on Tutorial Group 'Float001' tag as shown below. This will open a dialog box. Select 'Float Value' and click 'Add' also shown below.
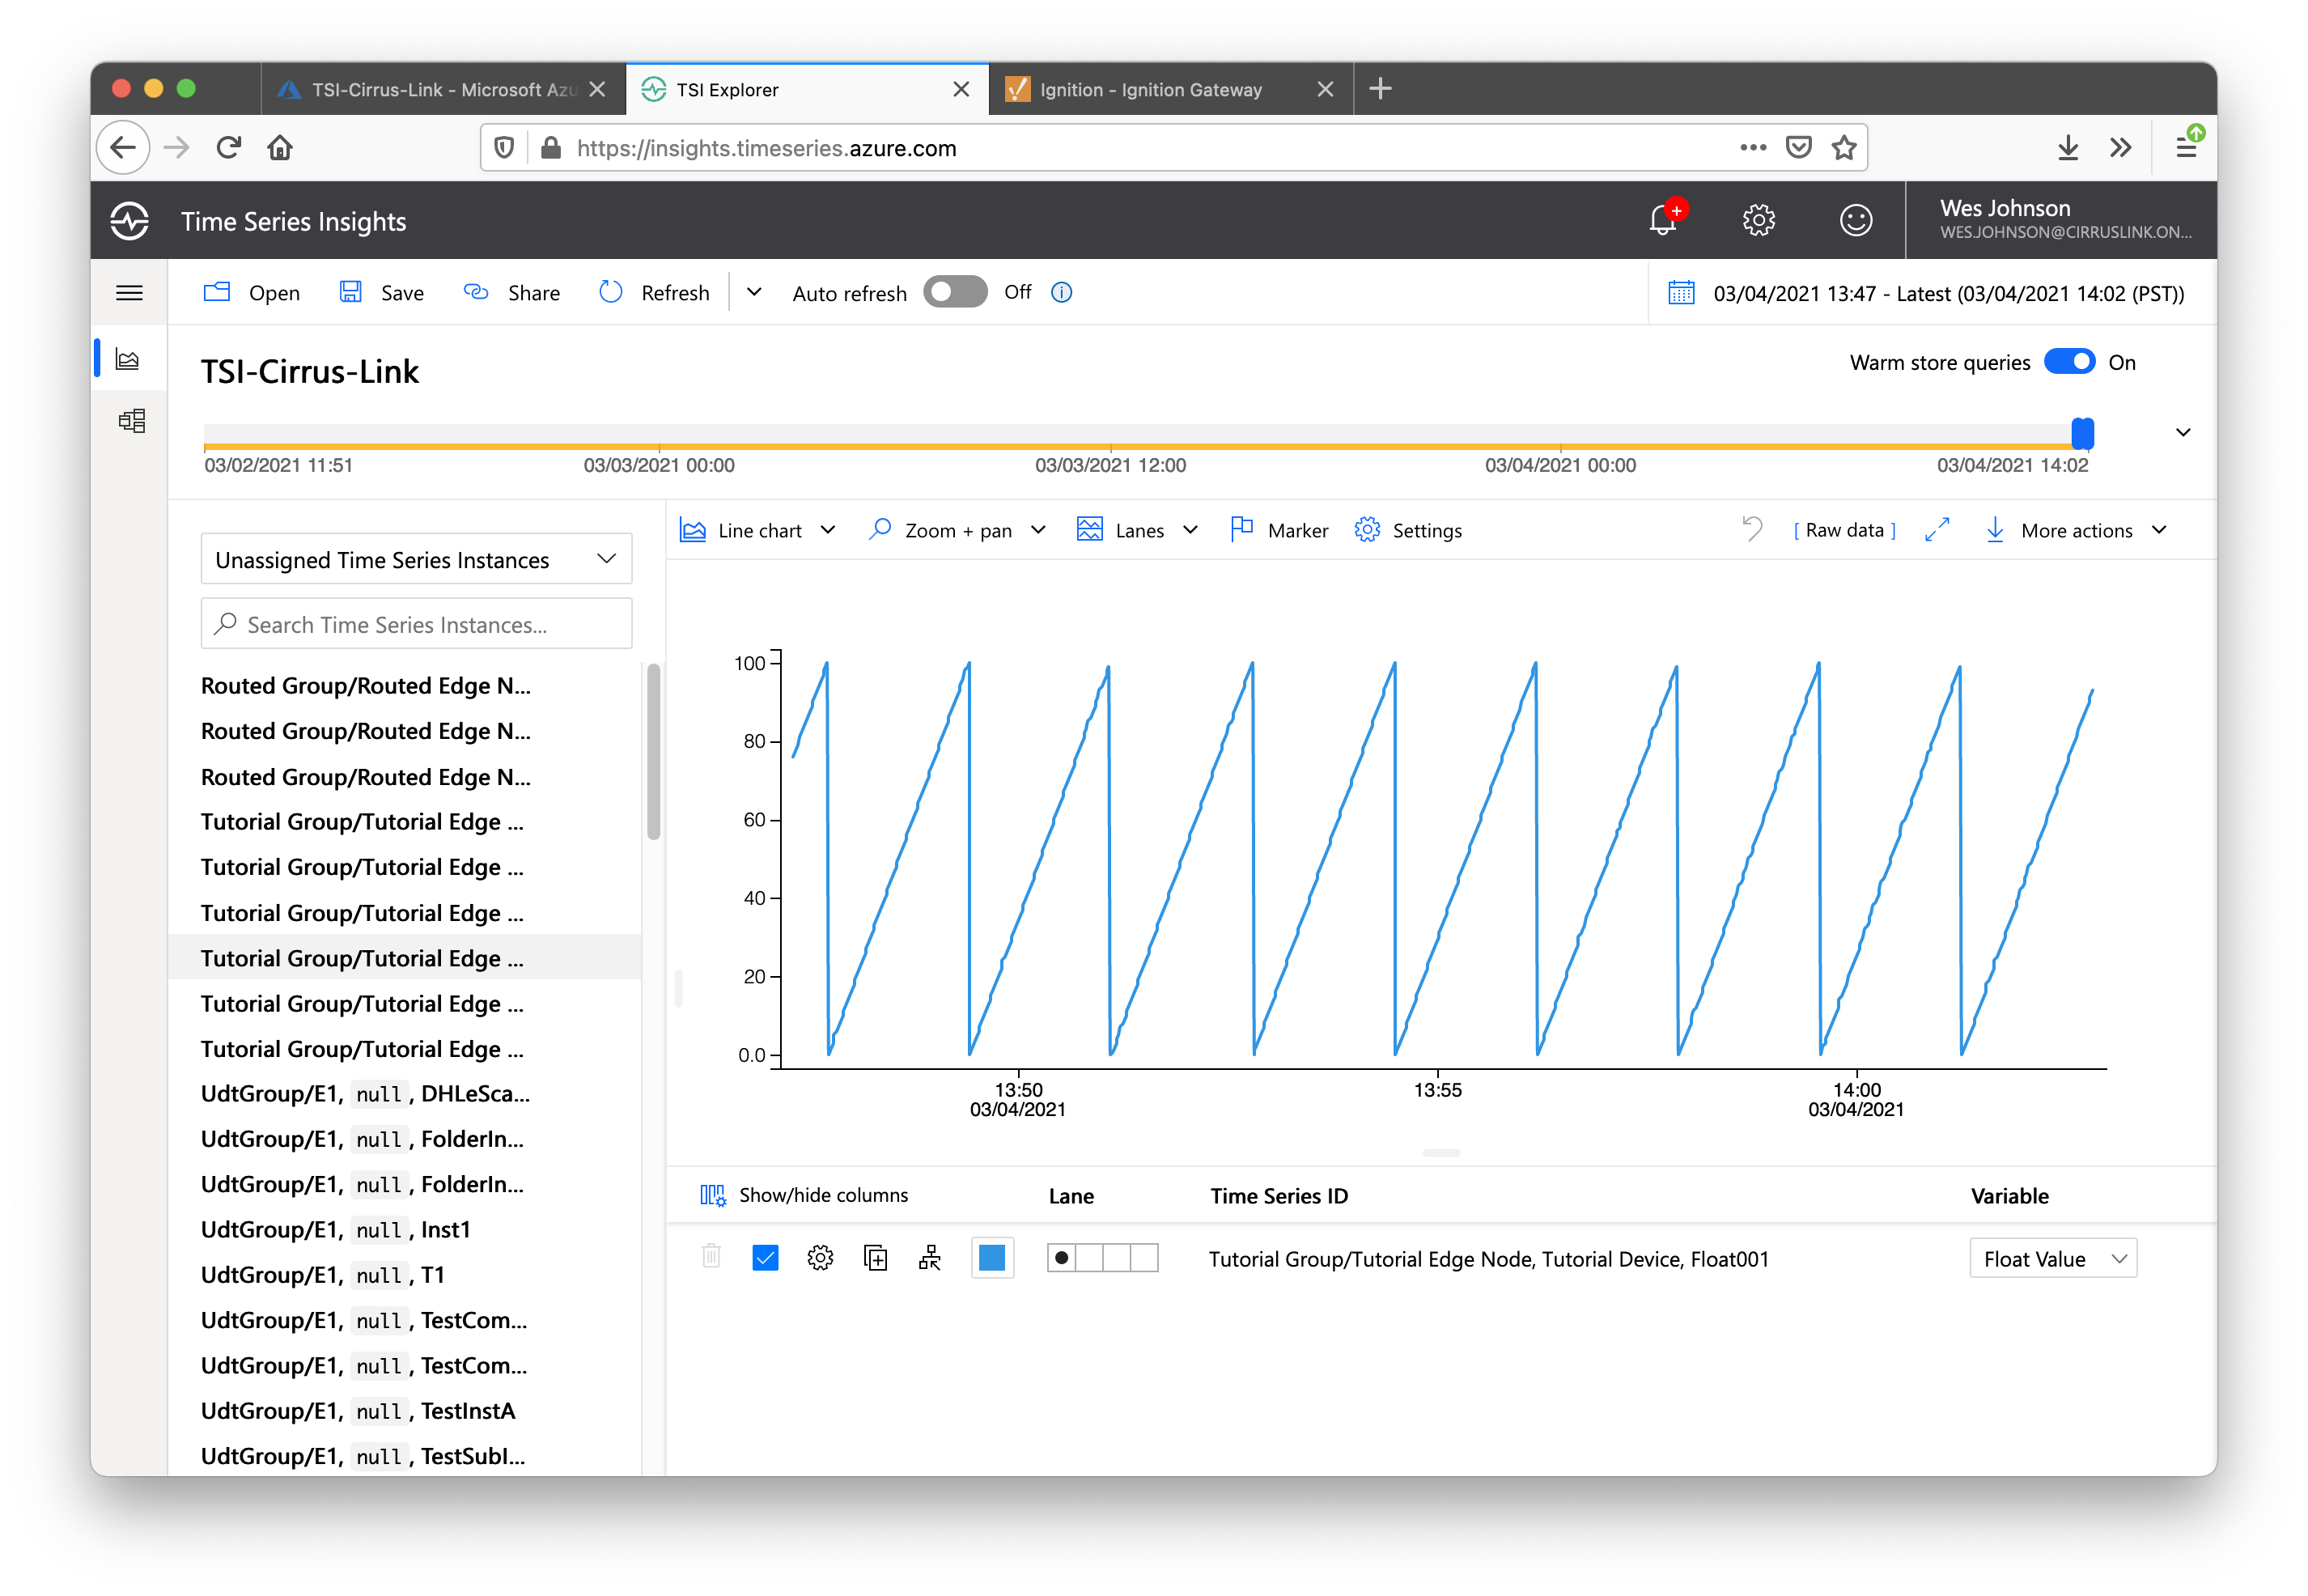
After doing so, you should see your time series data in the chart as shown below.