![]()
Contents
Cirrus Link Resources
Chariot MQTT Server v1 (previous version)![]()
Cirrus Link Modules for Ignition![]()
Contact Us (Sales/Support)![]()
Forum![]()
![]()
Chariot MQTT Server v1 (previous version)![]()
Cirrus Link Modules for Ignition![]()
Contact Us (Sales/Support)![]()
Forum![]()
...
The Chariot MQTT Server Web UI provides the following status pages for monitoring server activity, logs, and data.
| Anchor | ||||
|---|---|---|---|---|
|
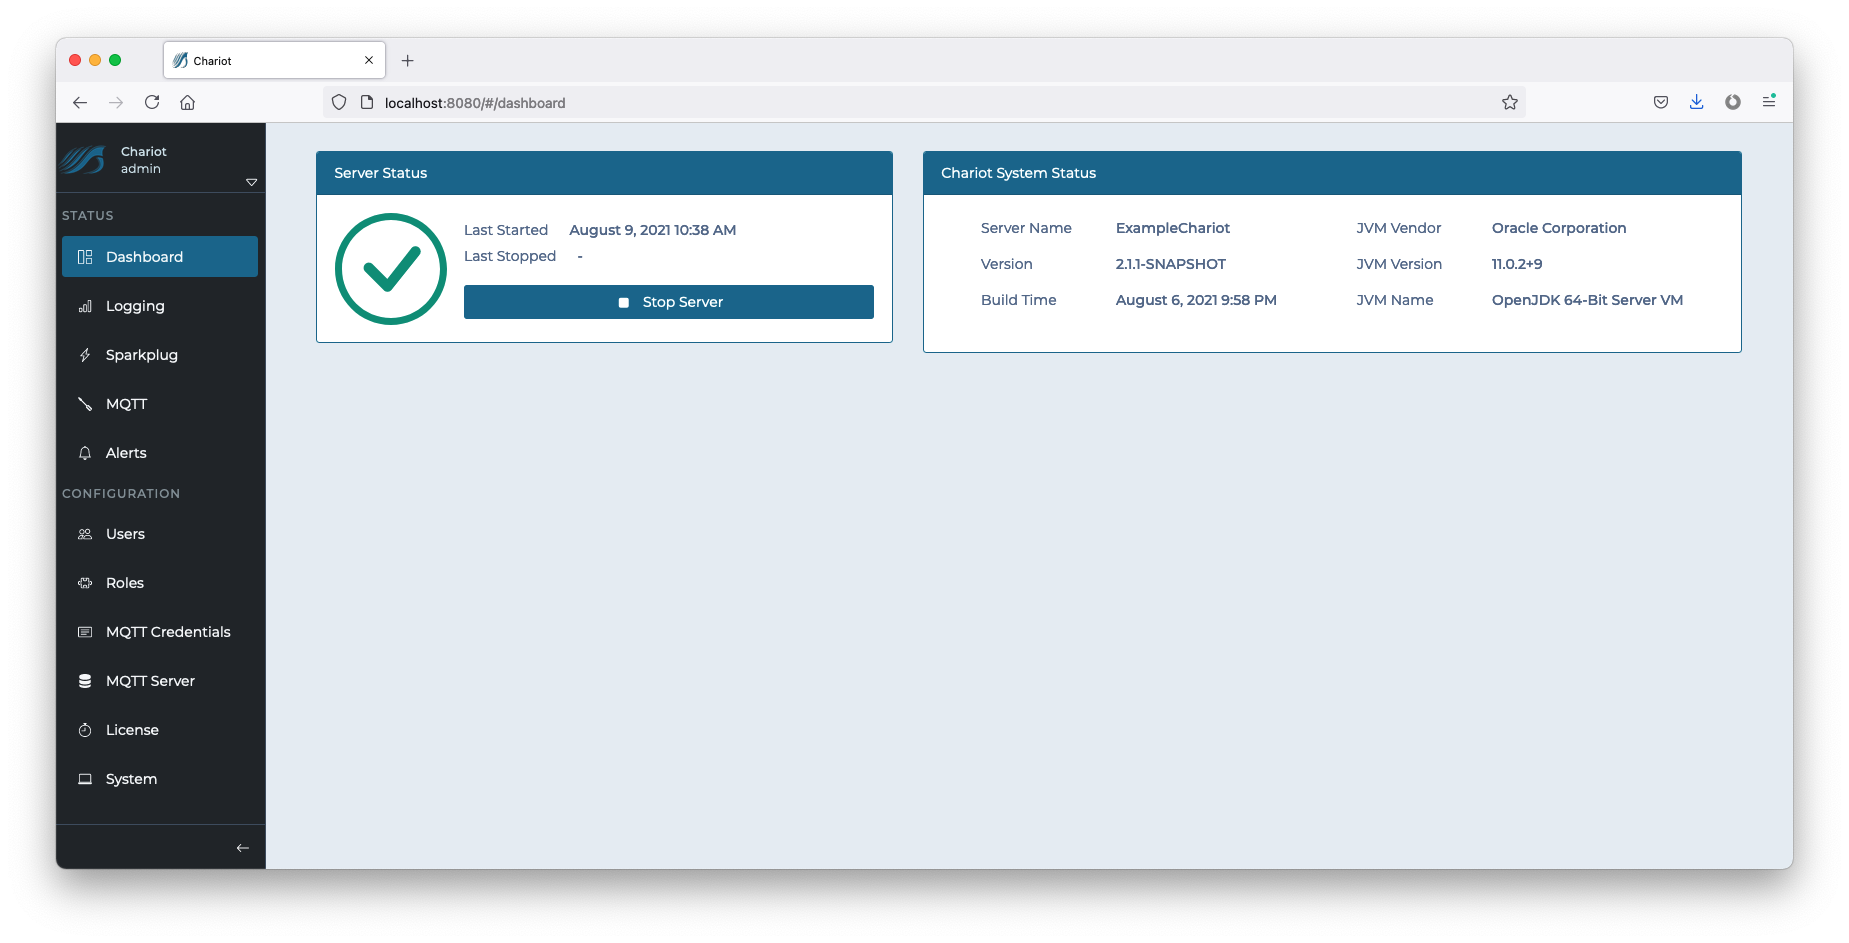
The Chariot dashboard provides a high level view of Chariot server and system status information.
| Anchor | ||||
|---|---|---|---|---|
|
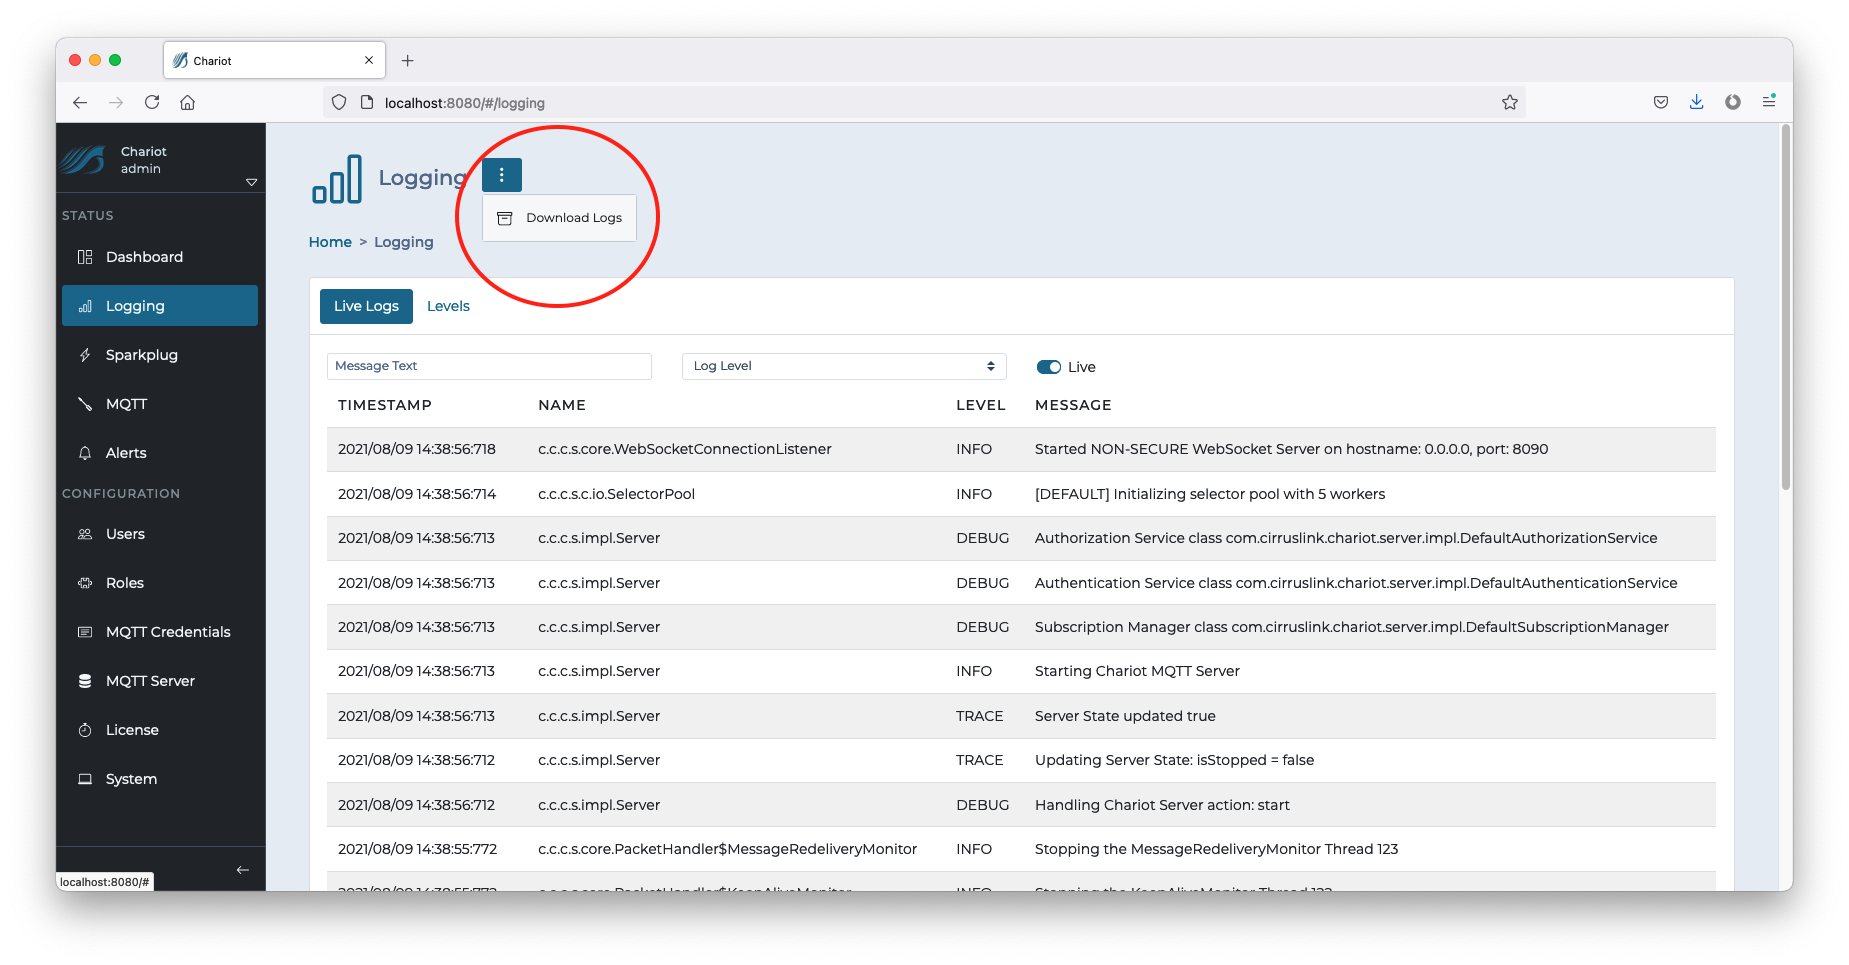
The Logging page has two tabs when a user can either view live Chariot logs or modify log levels. Additionally, a zip file containing the Chariot logs can be downloaded.
Live Chariot logs can be viewed on the Live logs tab. The live logs can be filtered by matching message text or selecting a minimum log level. A live toggle allows for enabling/disabling live log updates to the page.

The menu button at the top of the page contains an option for downloading a zip file containing the Chariot logs.
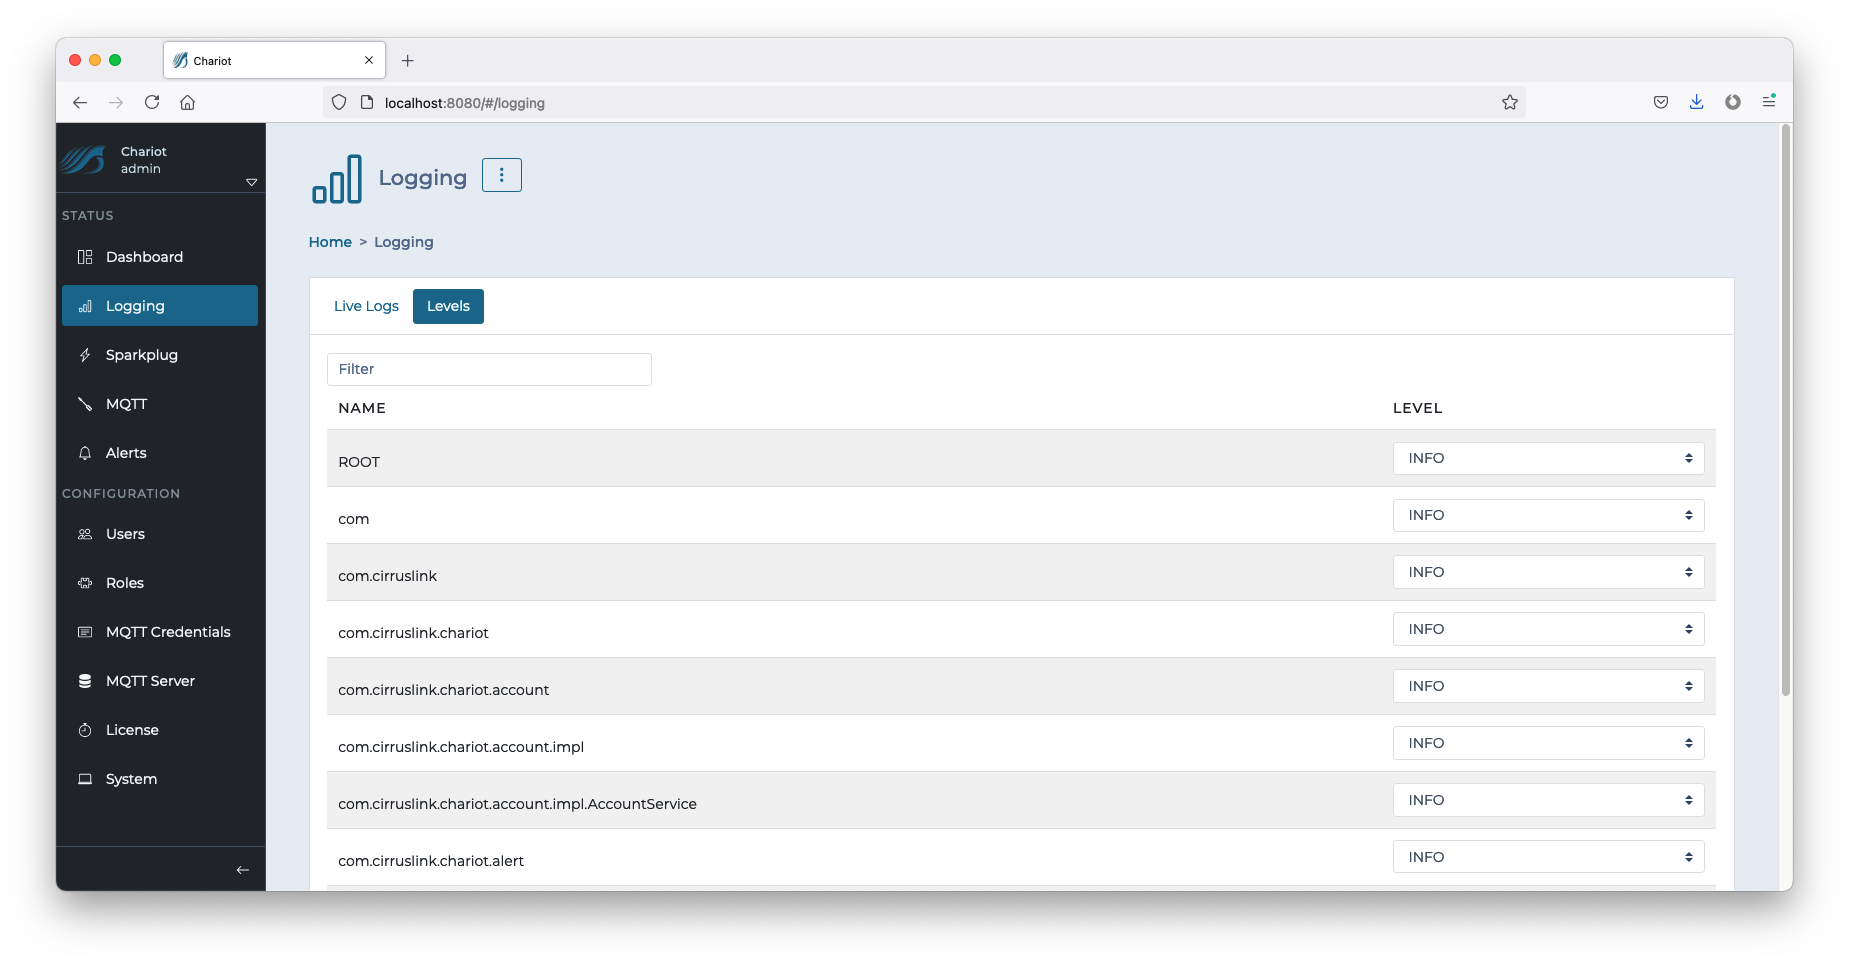
The second tabs allows for modifying log levels. The log levels can be filtered by name and each logger can have the level set to one of: TRACE, DEBUG, INFO, WARN, and ERROR.
| Anchor | ||||
|---|---|---|---|---|
|
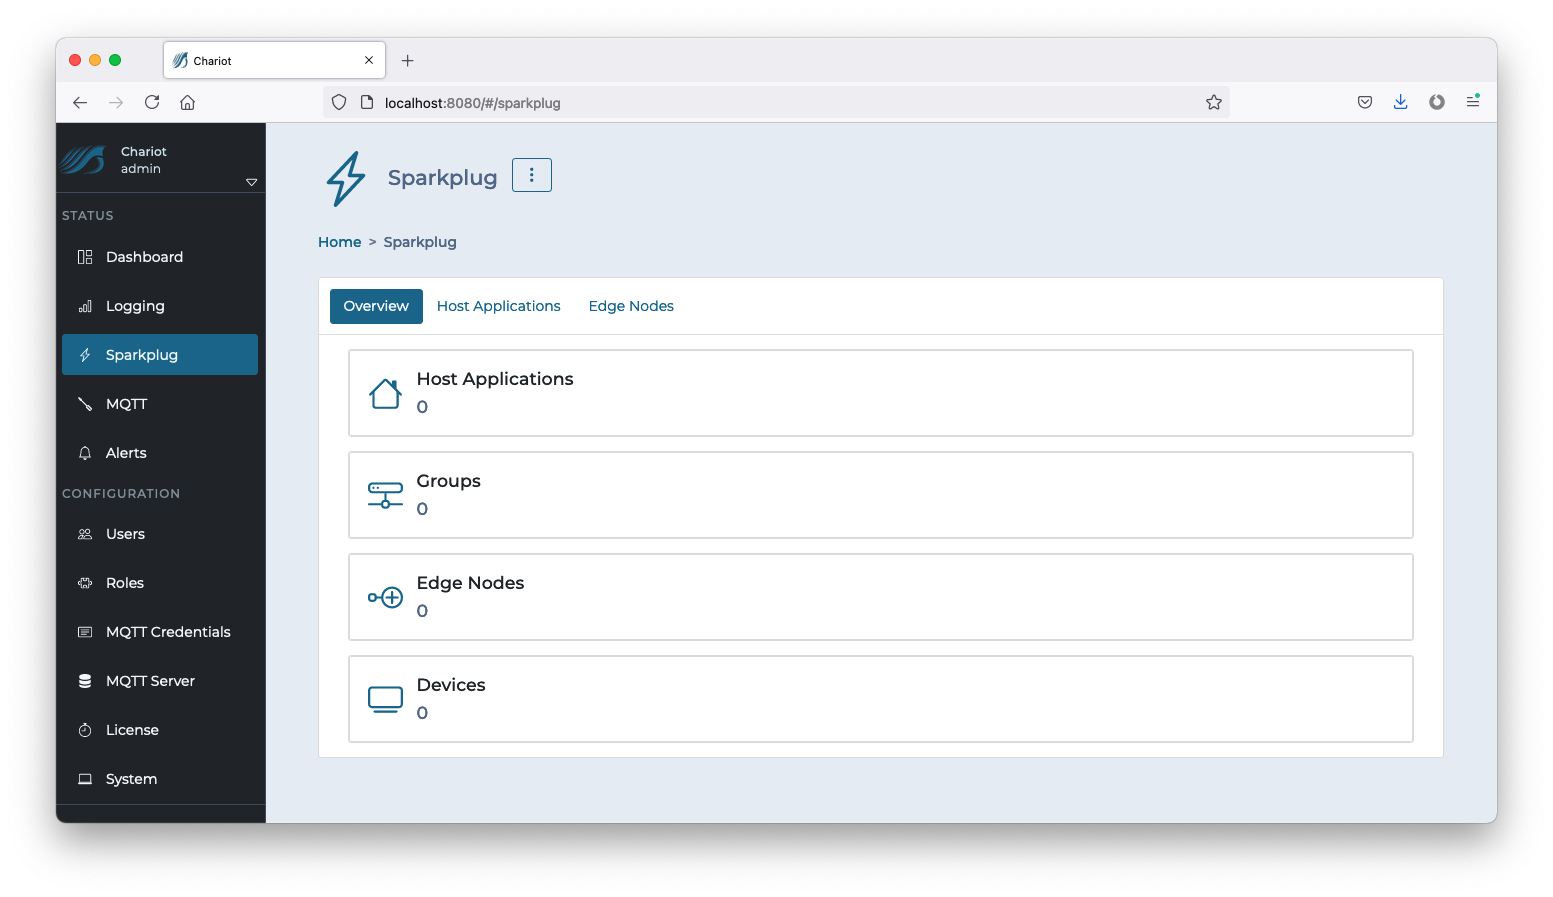
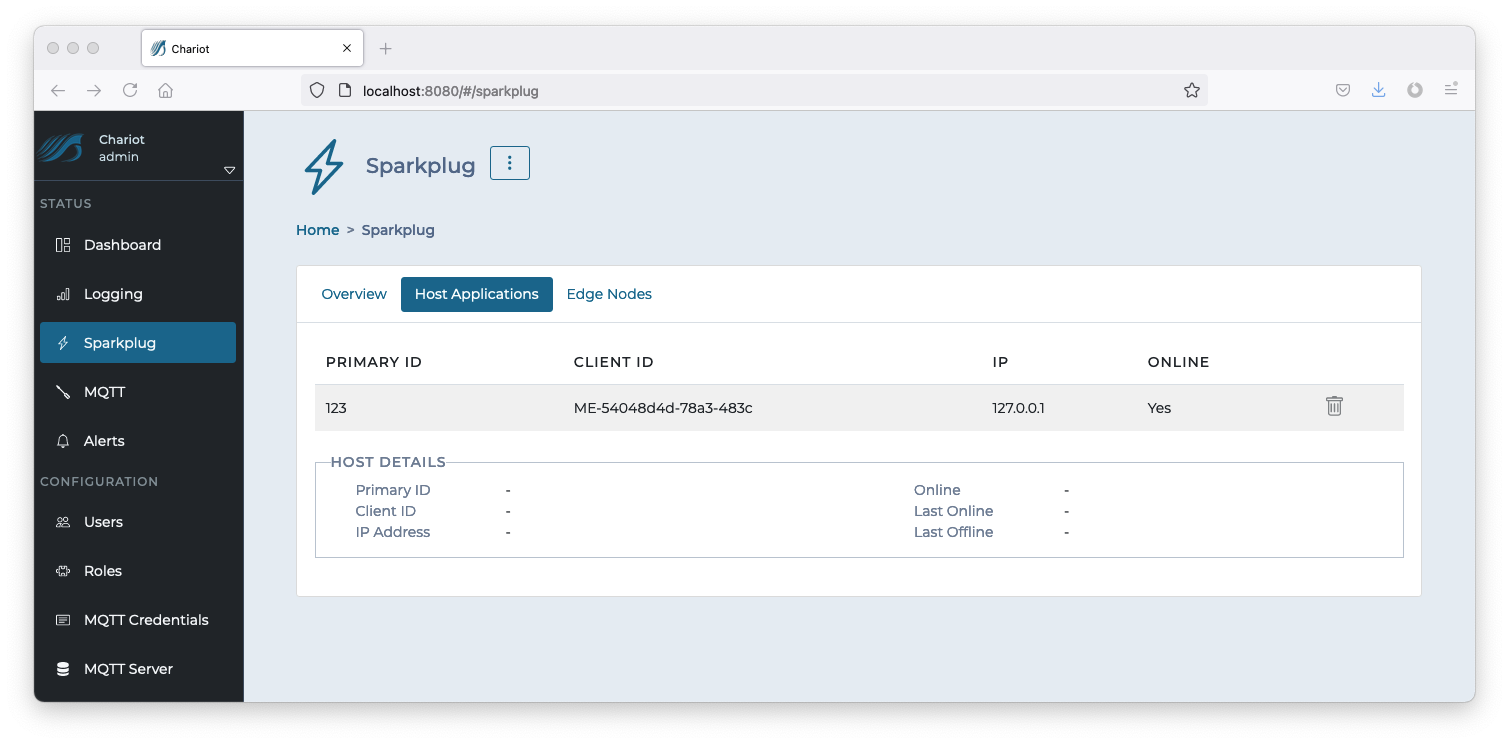
The Sparkplug page tracks data from Sparkplug MQTT clients that are connected to the Chariot MQTT server. The tracking can be disabled by clicking on the menu button at the top.
The Overview tab provides a quick look at the number of Sparkplug Host Applications, Groups, Edge Nodes, and Devices that are being tracked by Chariot.
 Host Applications
The Host Applications tab will show all Sparkplug Host applications that Chariot is tracking. Selecting a host application from the list will show additional details such as the last time it was online or offline.
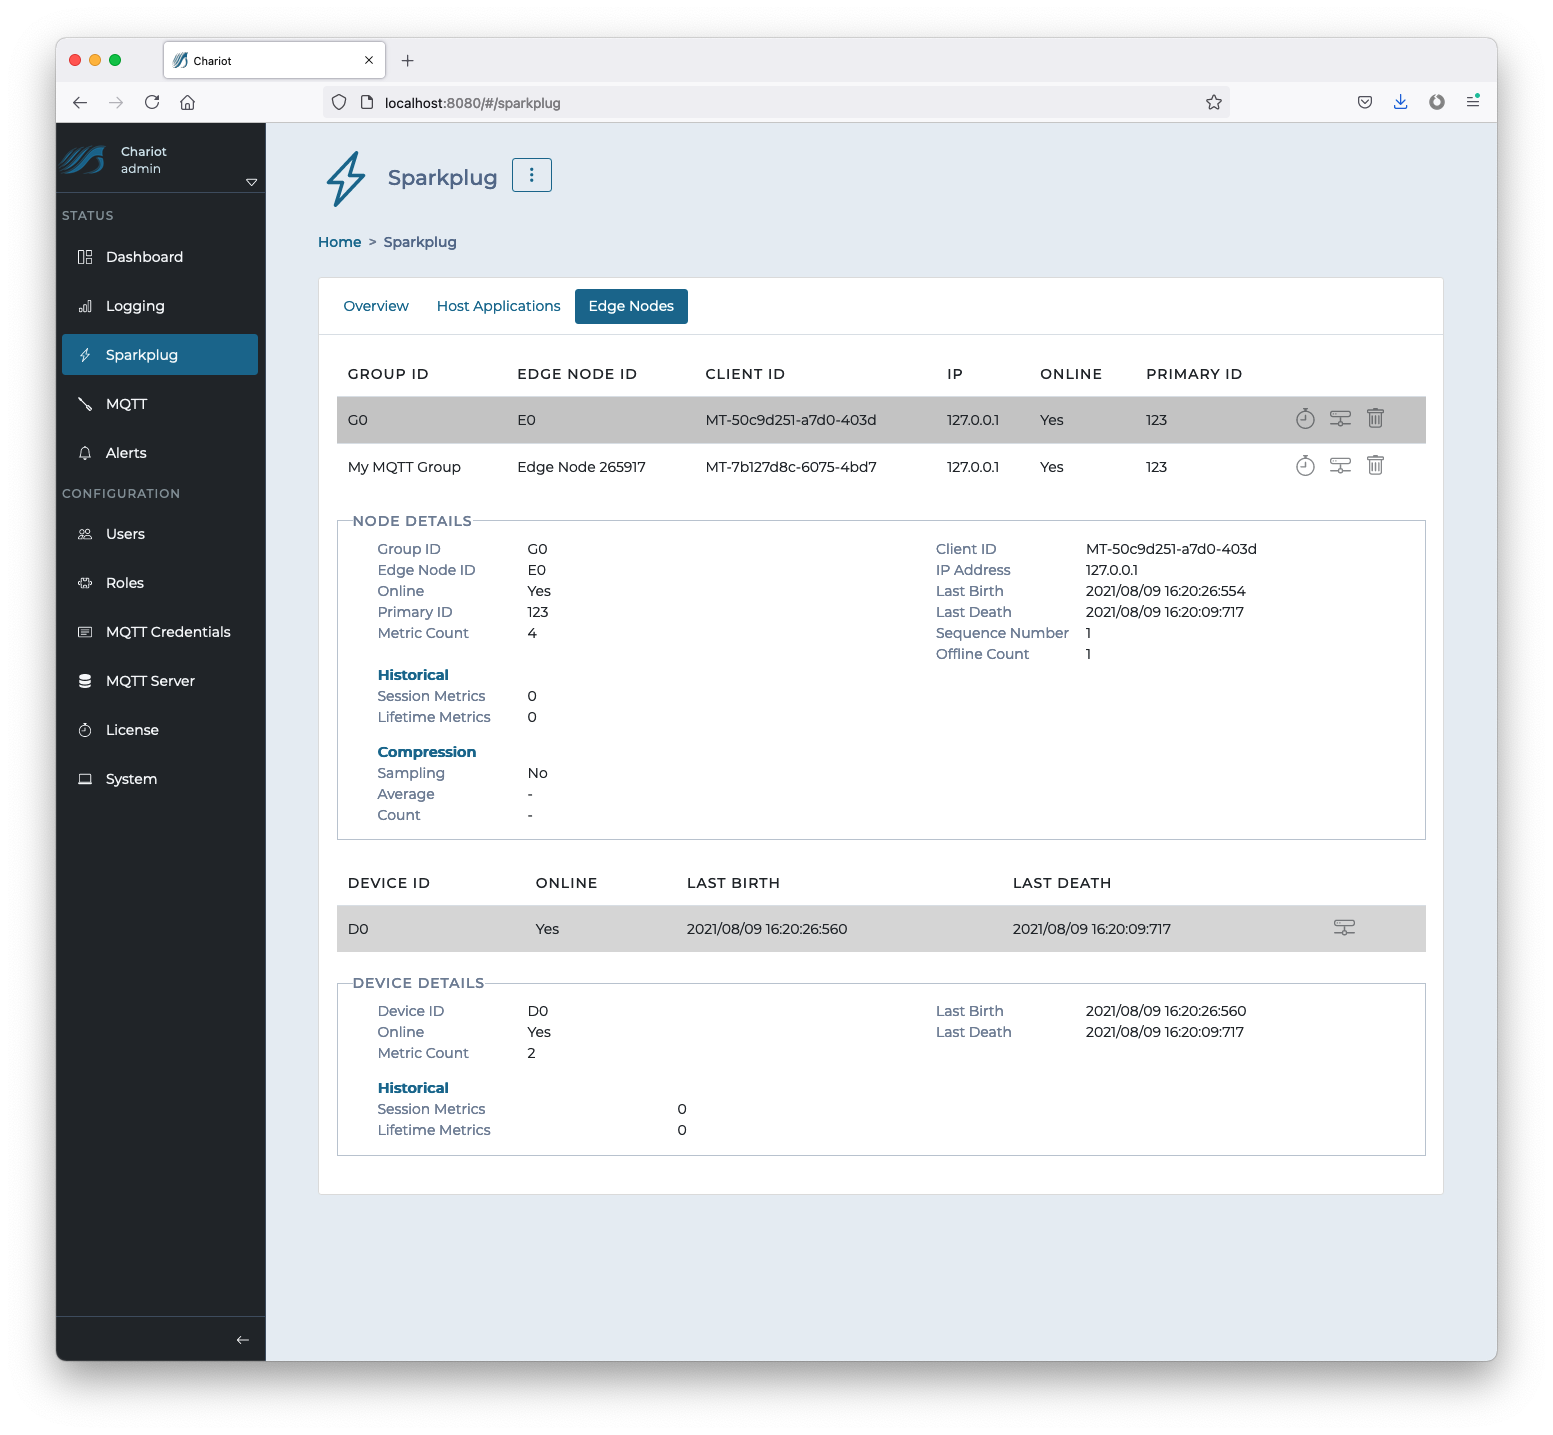
 Edge Nodes
The Edge Nodes tab will show all Sparkplug Edge Nodes and any Devices that Chariot is tracking. Selecting an Edge Node from the list will show additional details and also populate the list of the Edge Node's Devices below. Buttons on the far right of each Edge Node entry in the list provide tools for sampling compression and downloading the Sparkplug Edge Node birth (NBIRTH) and Device birth (DBIRTH) payloadS in JSON format.
| Anchor | ||||
|---|---|---|---|---|
|
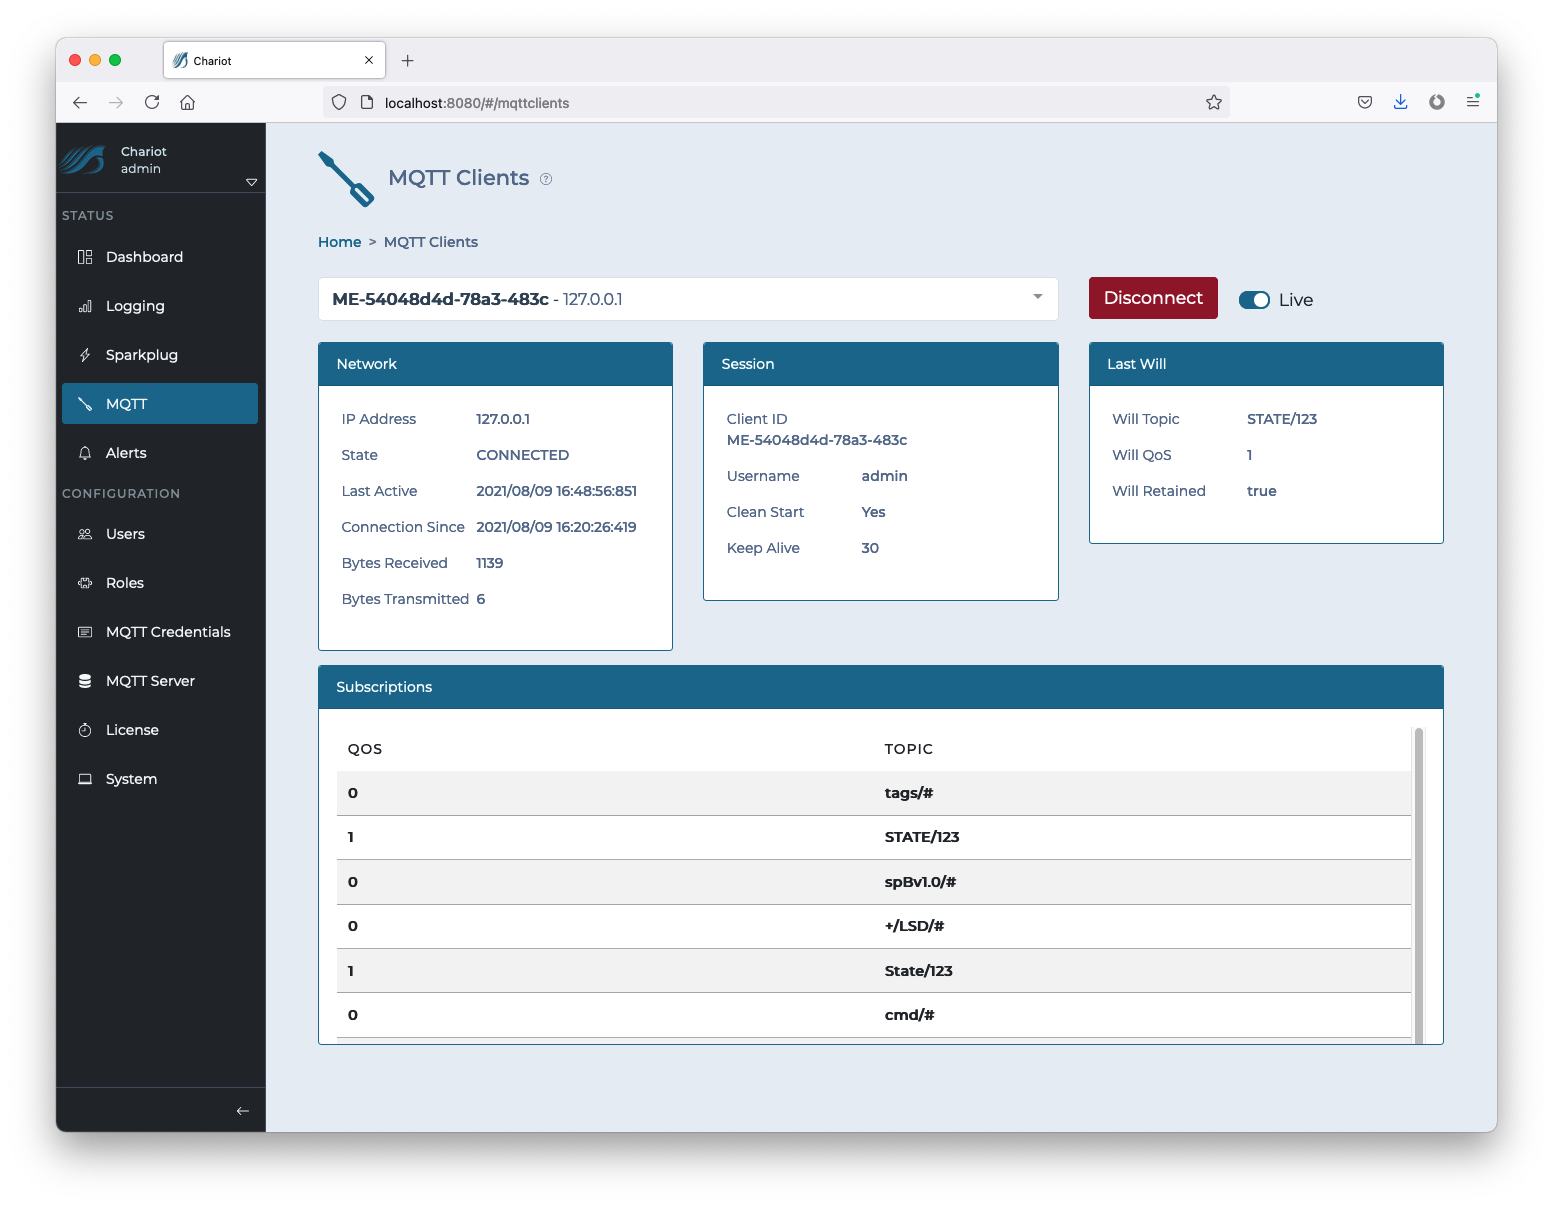
The MQTT Clients pages show details of all clients connected to the Chariot MQTT server. A searchable dropdown list is used to select an MQTT client and view network details, session information, LWT details, and a list of subscriptions.
| Anchor | ||||
|---|---|---|---|---|
|
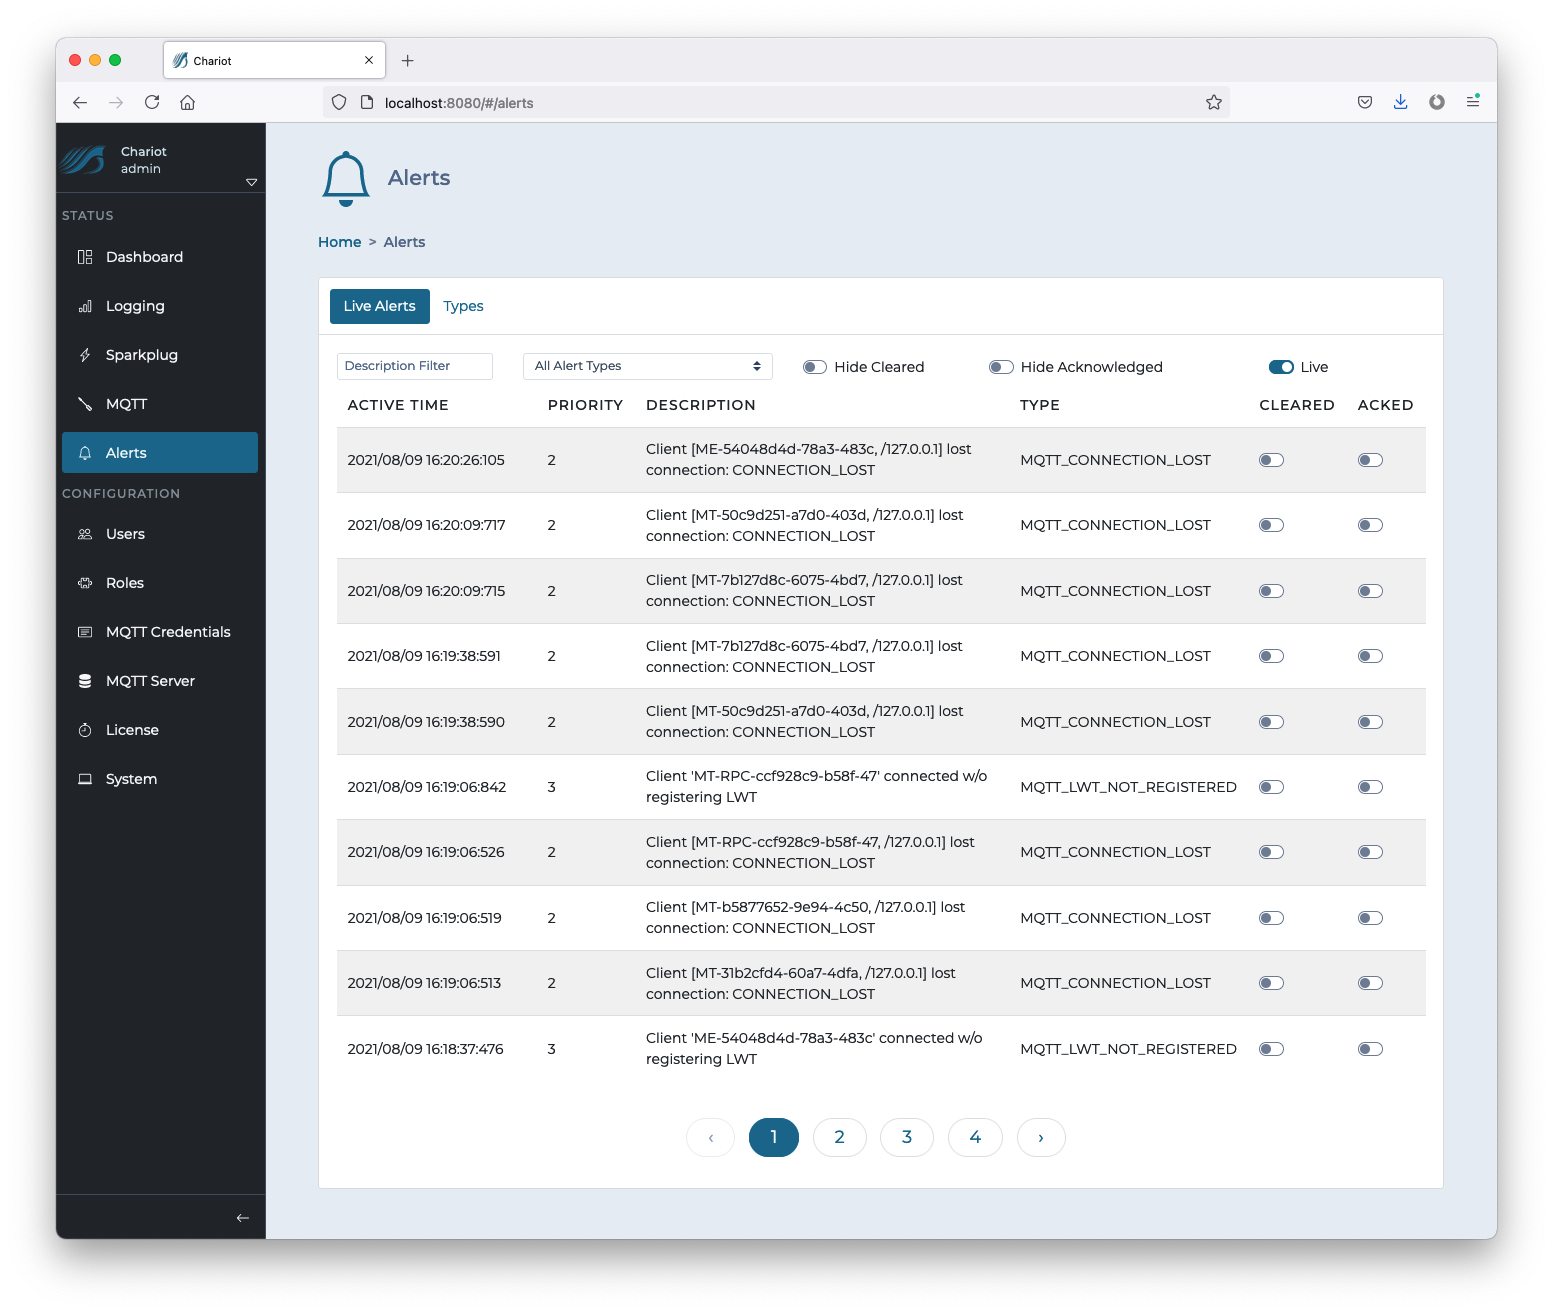
The Alerts page provides a place to view and manage any alerts that are generated in the Chariot Server
The Live Alerts tab shows a live view of alerts as they are generated. Individual alerts can be acknowledge and cleared. The alerts displayed can be filtered by matching text in the description, selecting an alert type, and/or hiding cleared or acknowledged alerts.
 Types
TypesThe Types tab allows for the enabling/disabling of specific alert types as well as changing the priority (1, 2, or 3).
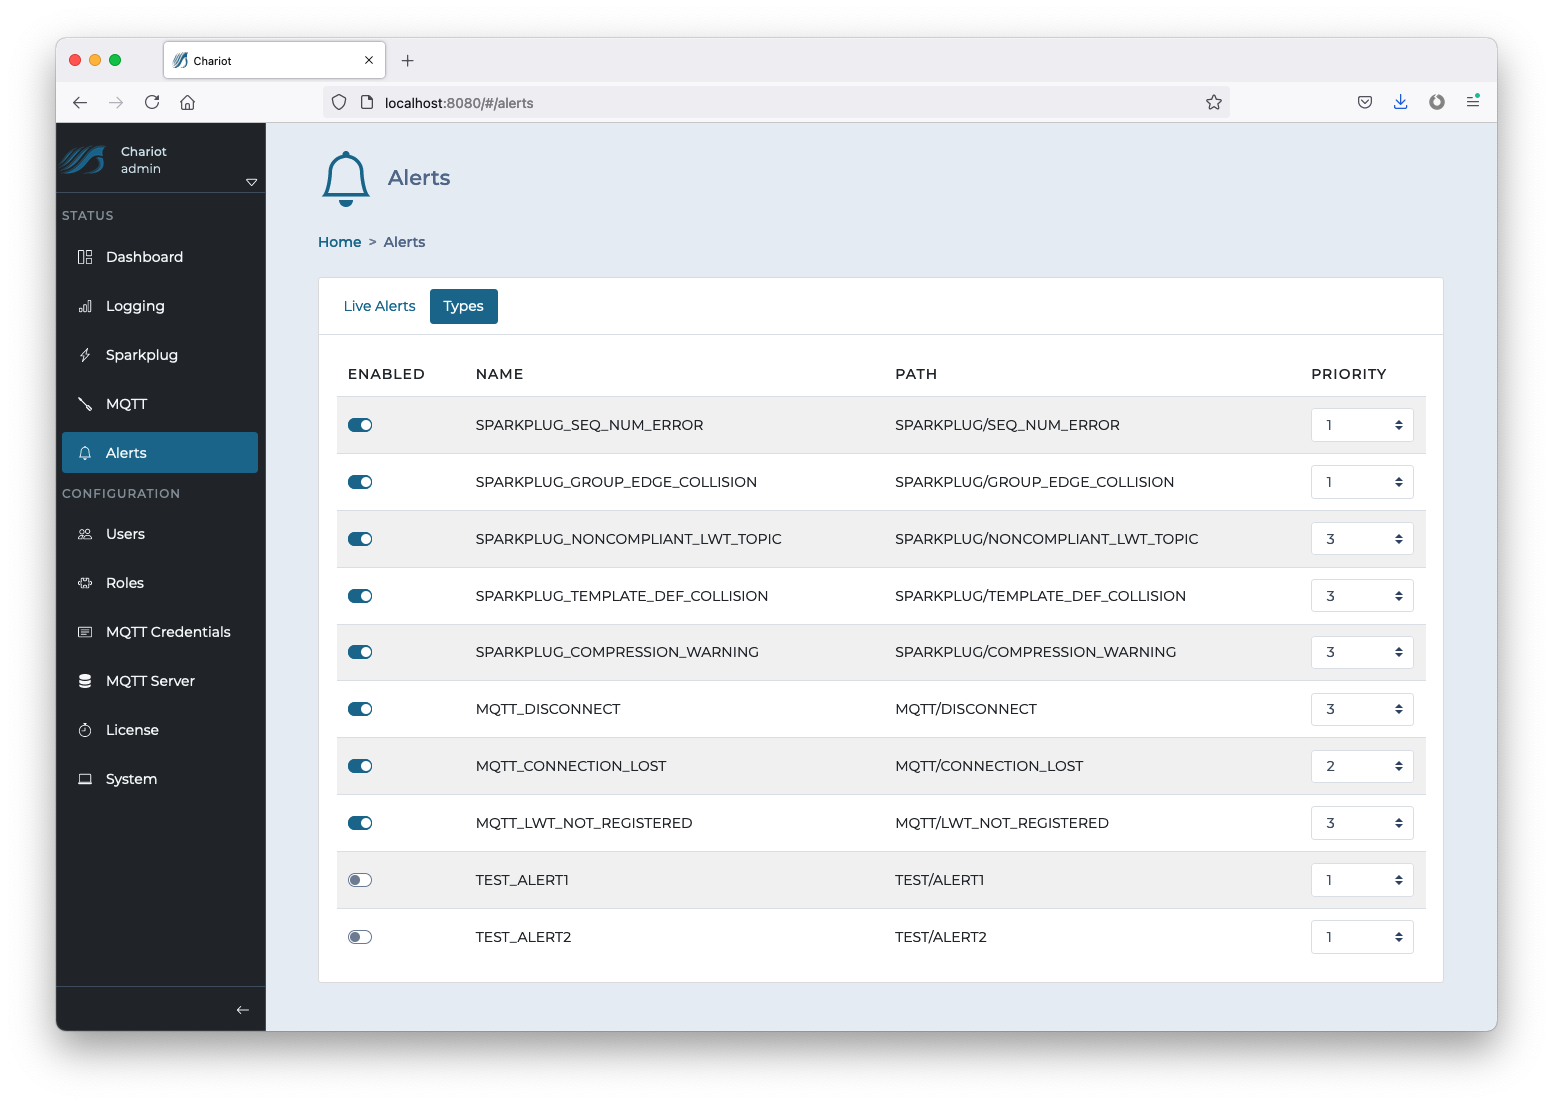 Some of the Alert Types supported in the Chariot Server include: